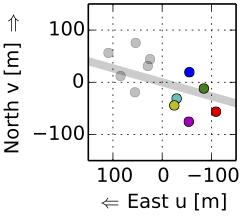
Fig. B.1
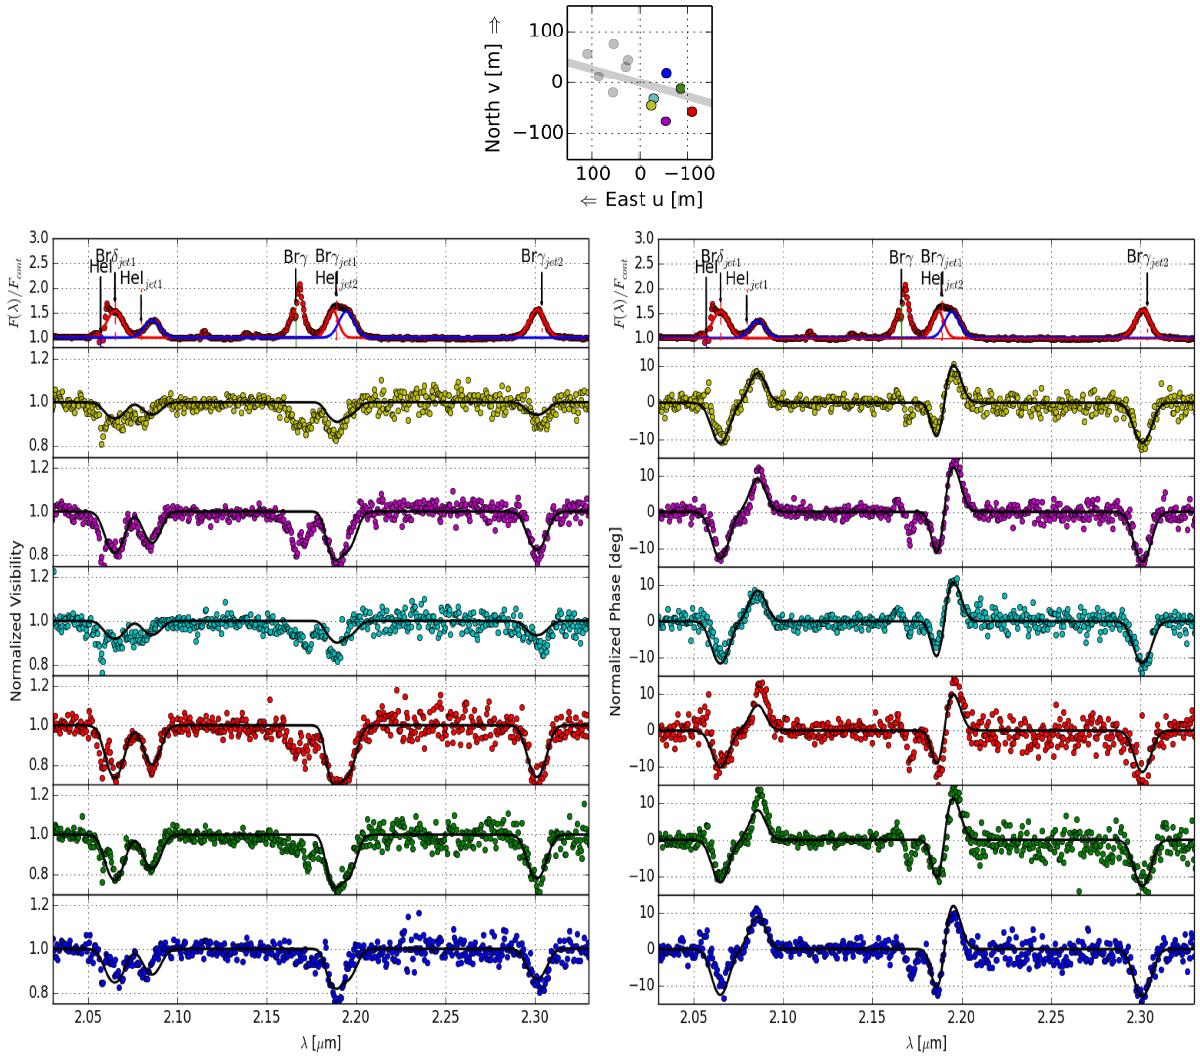
(Top) uv plane at the time of the observation (average over the full exposure) with the different baselines indicated by colored points. The gray line represents the expected jet PA. (Bottom) K-band GRAVITY spectrum (the solid blue/red line corresponds to the emission of the approaching/receding jet components) as well as the visibility amplitudes (left) and phases (right) for the six baselines. The solid line corresponds to the best fit model of the jet lines (see Sect. 3.2.2). The symbol colors correspond to the baseline colors indicated in the uv plane.
Current usage metrics show cumulative count of Article Views (full-text article views including HTML views, PDF and ePub downloads, according to the available data) and Abstracts Views on Vision4Press platform.
Data correspond to usage on the plateform after 2015. The current usage metrics is available 48-96 hours after online publication and is updated daily on week days.
Initial download of the metrics may take a while.