Fig. 1
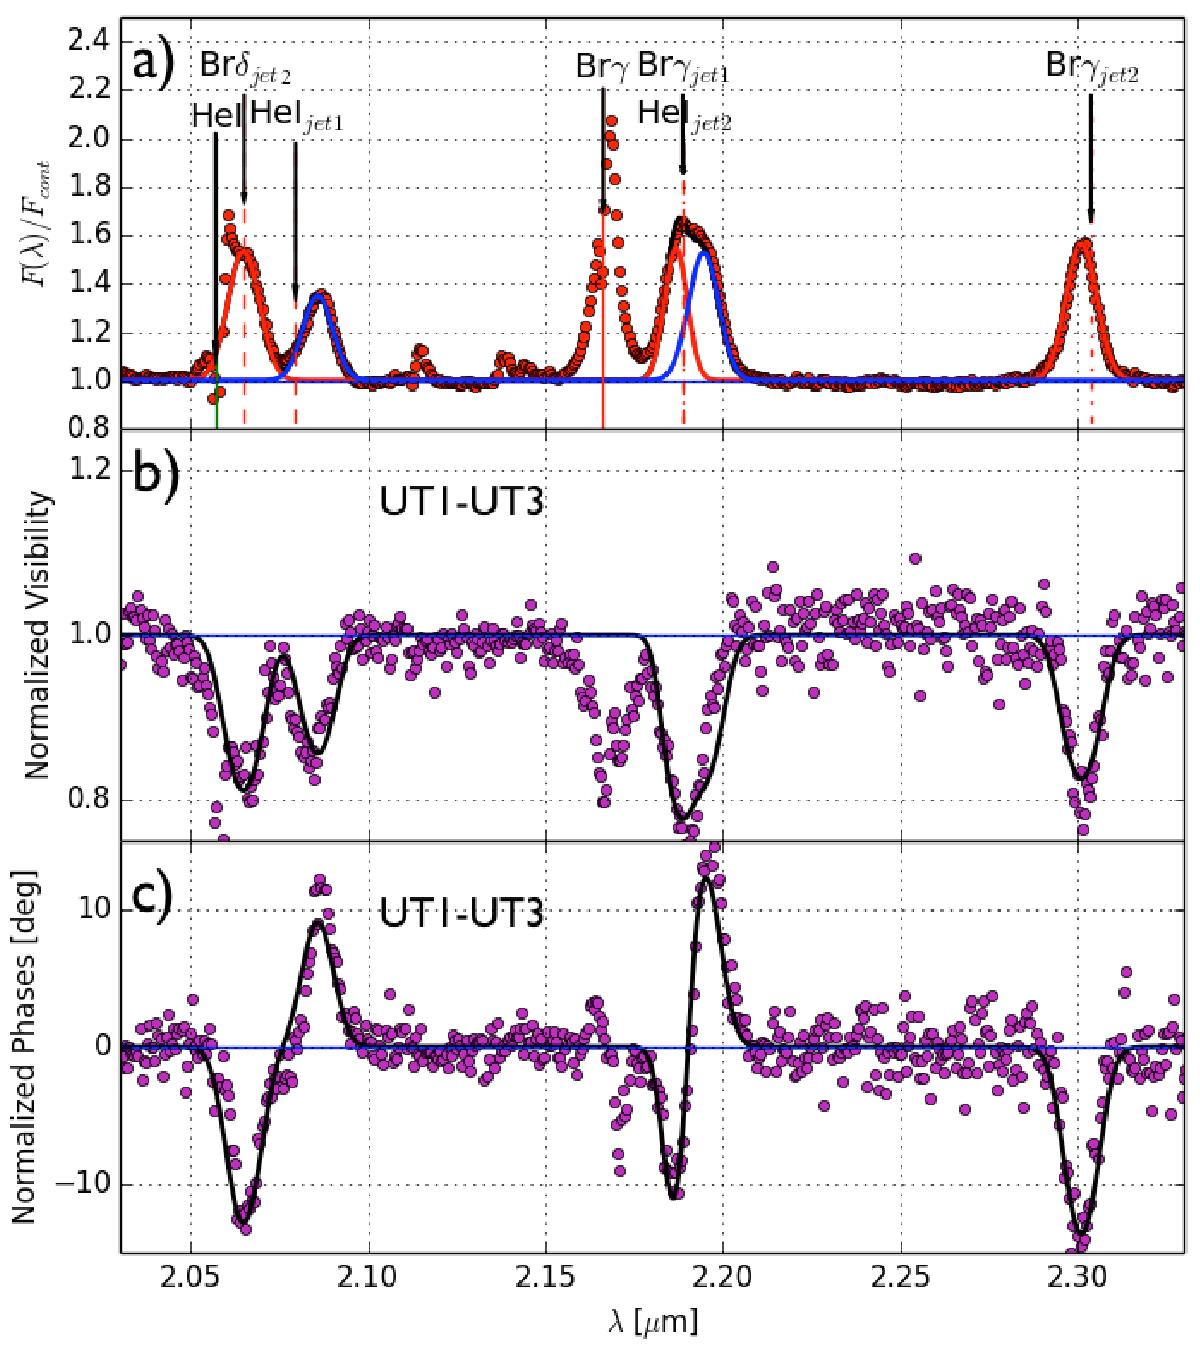
a) Normalized K-band spectrum (with a binning over 2 spectral channels) obtained with GRAVITY. The Brγand He i lines as well as the expected position of the corresponding jet lines (jet1/jet2 for the approaching/receding jet) are indicated by vertical lines. We have also reported the expected position of the Brδjet2 line from the receding jet. The solid blue/red line corresponds to the emission of the approaching/receding jet components. b) Visibility amplitudes and c) phases on the UT1-UT3 baseline (the visibility amplitudes and phases of all the baselines as well as the uv-plane at the time of the observation are shown in the Appendix, in Fig. B.1). For the phase, we follow the sign convention of Pauls et al. (2005), such that negative phases point to the baseline direction. The solid black line corresponds to the best fit model of the jet lines (see Sect. 3.2.2).
Current usage metrics show cumulative count of Article Views (full-text article views including HTML views, PDF and ePub downloads, according to the available data) and Abstracts Views on Vision4Press platform.
Data correspond to usage on the plateform after 2015. The current usage metrics is available 48-96 hours after online publication and is updated daily on week days.
Initial download of the metrics may take a while.