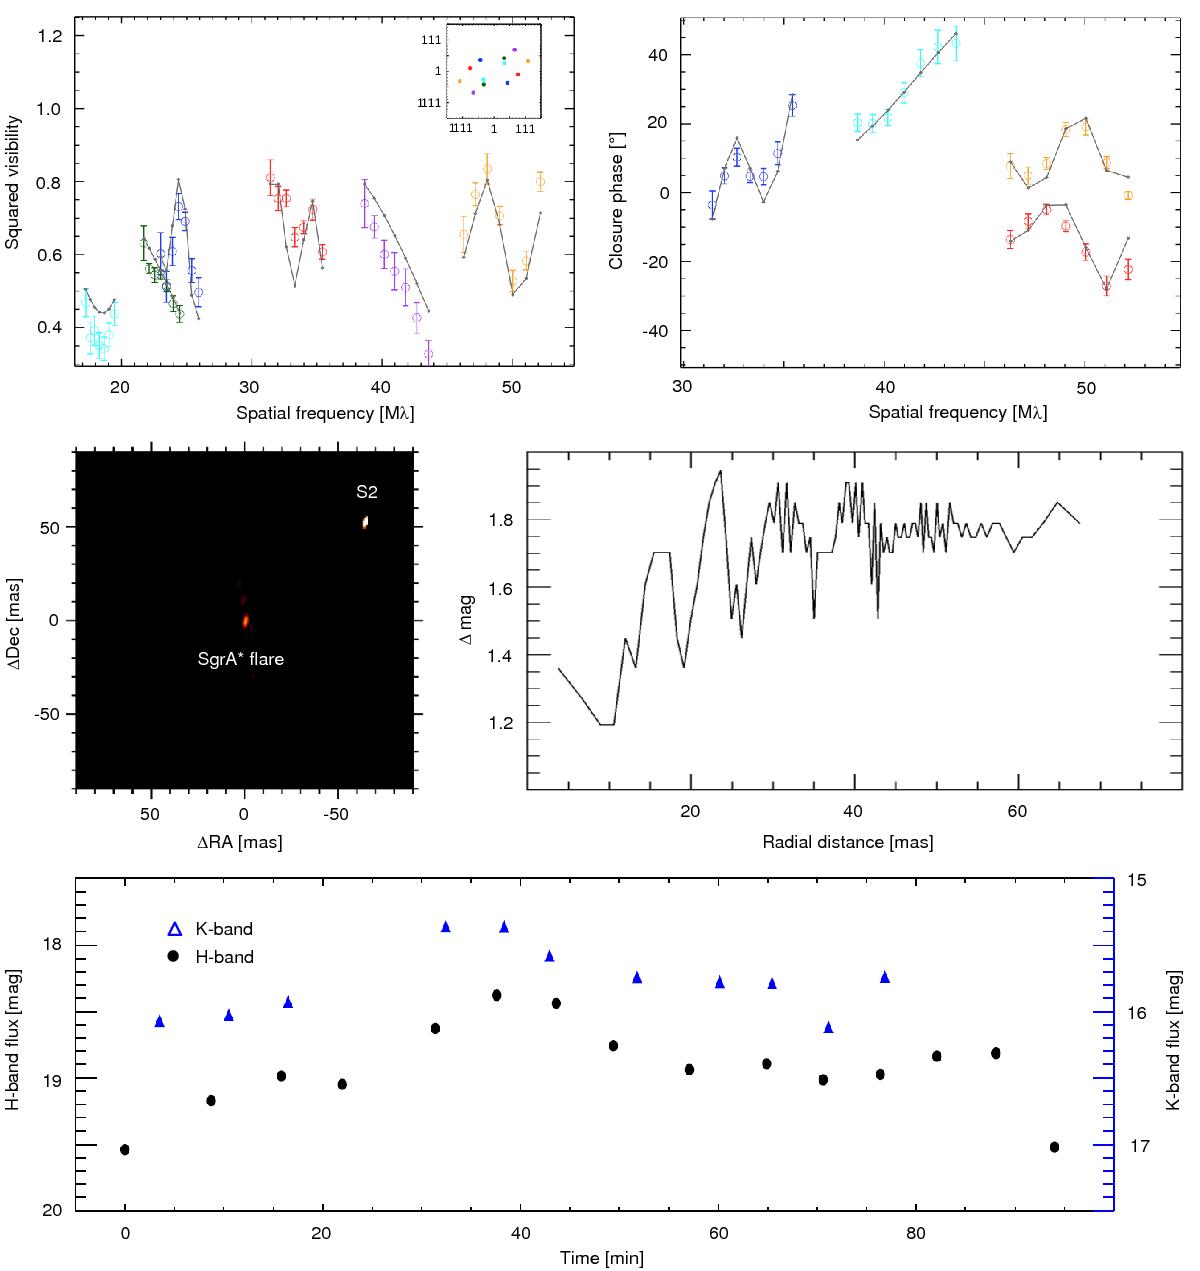
Fig. 22
First detection of Sgr A* in infrared interferometry: the top panels show the observed squared visibilities and closure phases for a five minute exposure centered on Sgr A* during a flare with a peak brightness of about mK ≈ 15 mag. The prominent modulation in the two quantities results from the two brightest objects in the field, the flaring Sgr A* and the star S2. The black line is the best fit “binary” model. The middle left panel displays the reconstructed image from the combination of three exposures around the peak of the flare. The middle right panel plots the 3σ detection limits for a third source in the full data set, for which the average flare brightness was mK ≈ 15.5 mag. We can exclude a third source brighter than mK = 17.1 mag for 90% of the area. The lower panel shows the H-band (black circles) and K-band (blue triangles) lightcurve of Sgr A* during the flare, as measured from the acquisition camera images and derived from the best fit to the interferometric visibilities and closure phases, respectively.
Current usage metrics show cumulative count of Article Views (full-text article views including HTML views, PDF and ePub downloads, according to the available data) and Abstracts Views on Vision4Press platform.
Data correspond to usage on the plateform after 2015. The current usage metrics is available 48-96 hours after online publication and is updated daily on week days.
Initial download of the metrics may take a while.