Fig. 20
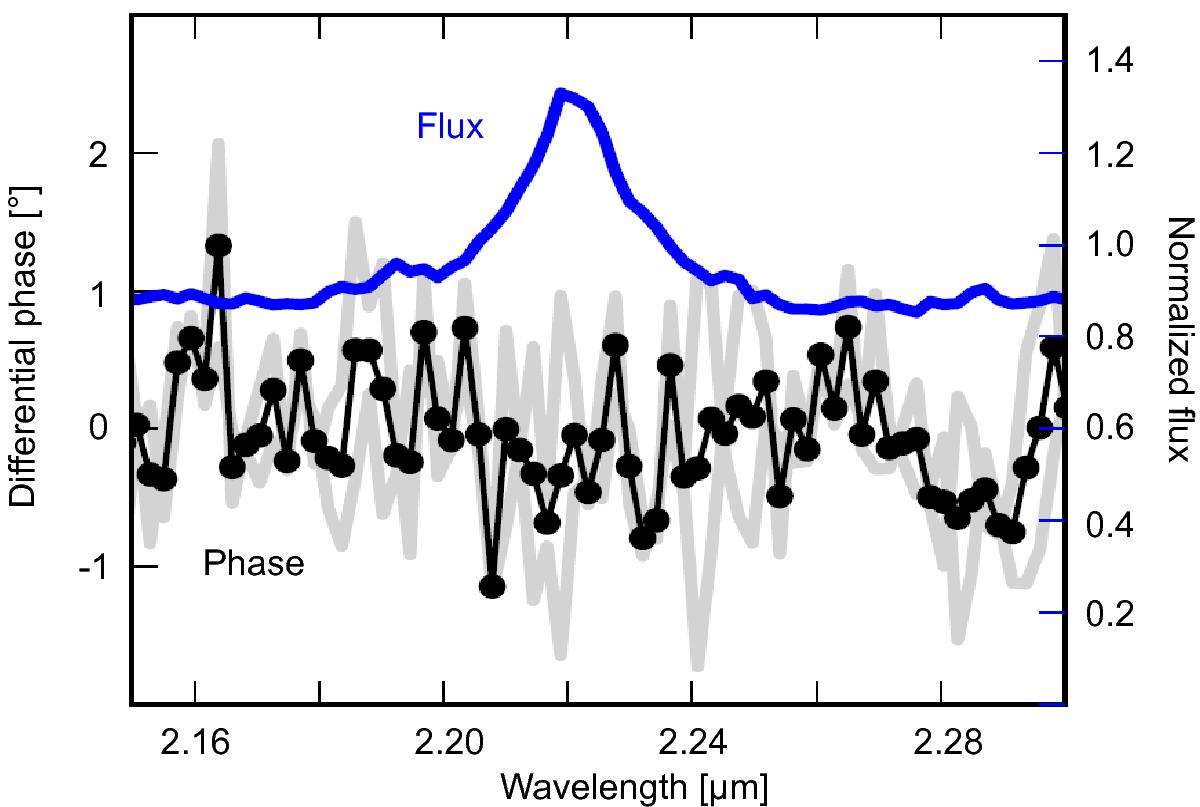
Broad line region of the quasar PDS 456: the plot shows the normalized spectrum (blue) and differential phase (black) of the broad Paα line for the average of the UT1-UT4 and UT2-UT4 baselines (individual baselines in light gray). No differential phase signature is detected, neither in the individual baselines nor in their average, despite a precision of ≲1°.
Current usage metrics show cumulative count of Article Views (full-text article views including HTML views, PDF and ePub downloads, according to the available data) and Abstracts Views on Vision4Press platform.
Data correspond to usage on the plateform after 2015. The current usage metrics is available 48-96 hours after online publication and is updated daily on week days.
Initial download of the metrics may take a while.