Fig. 19
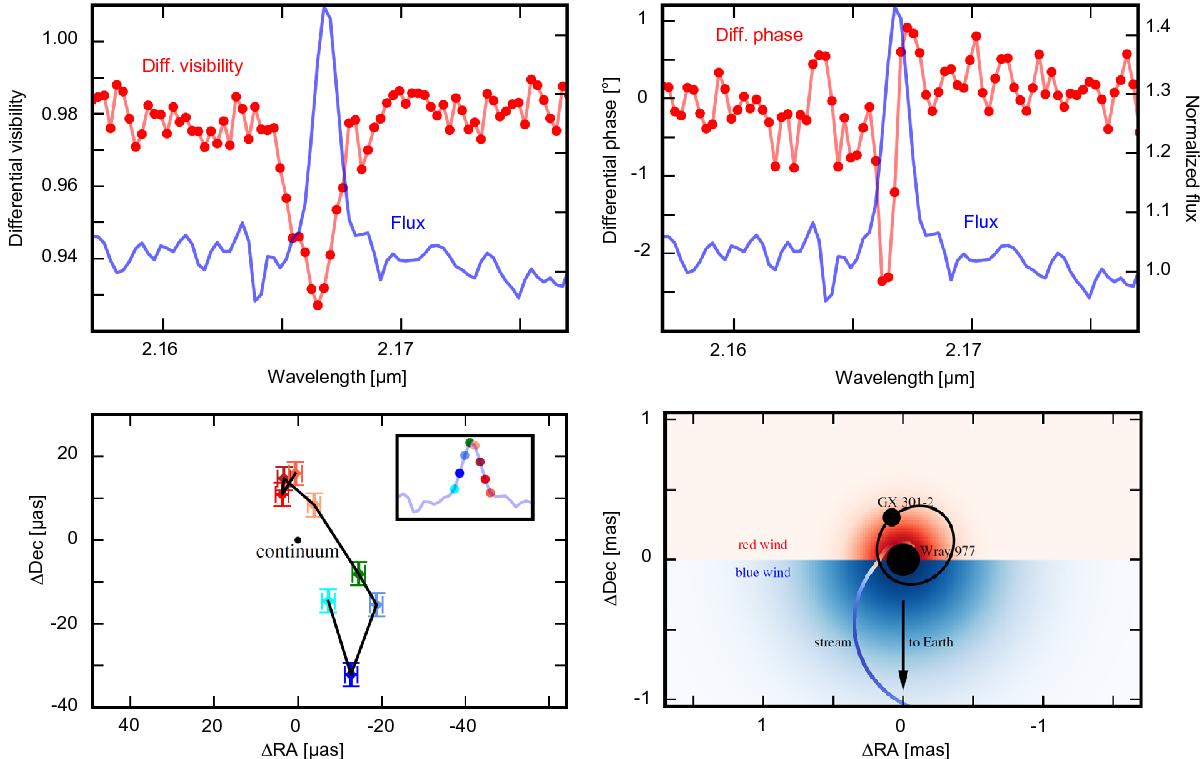
Tracing the inner region of the HMXB BP Cru: the top figures display the differential visibility amplitudes (left) and phases (right) across the Brγ line (red) and the continuum normalized spectrum (blue) exemplary for one of the six observed baselines. The lower left panel shows the model-independent centroid positions for each wavelength across the Brγ line. The image on the blue side of the line has a larger centroid shift than the image on the red side. We note the μas scale on the lower left panel. The schematic on the lower right panel shows the BP Cru system as inferred from simple geometric model fits to the interferometric signatures. The donor star, the X-ray pulsar, and its binary orbit are shown in black. An extended wind could explain the visibility amplitude drops across the emission line. A size asymmetry between the blue and red shifted sides of the wind could be related to the X-ray illumination by the compact object. Non-zero visibility phases, also asymmetric between blue and red wavelengths, could be explained by the presence of a gas stream. A simple stream model following Leahy & Kostka (2008) is shown in the bottom right, with the colors along the stream corresponding to the radial velocity measured at Earth (i = 60°).
Current usage metrics show cumulative count of Article Views (full-text article views including HTML views, PDF and ePub downloads, according to the available data) and Abstracts Views on Vision4Press platform.
Data correspond to usage on the plateform after 2015. The current usage metrics is available 48-96 hours after online publication and is updated daily on week days.
Initial download of the metrics may take a while.