Fig. 18
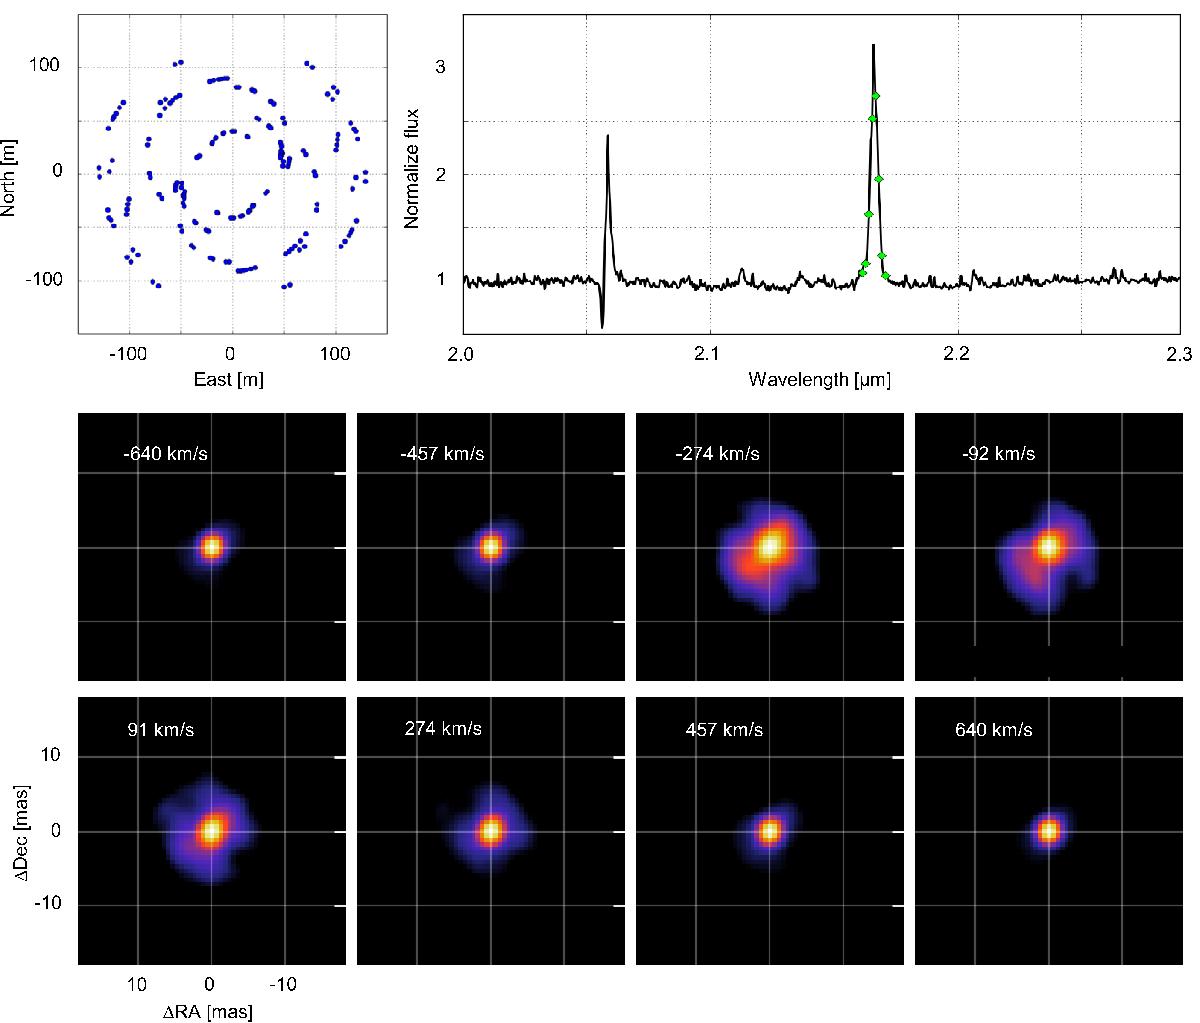
Core of η Car at mas resolution: the top left panel displays the baseline coverage of our observations with the ATs. The top right panel shows the observed spectrum around the He i and Brγ emission lines. The lower panels present the reconstructed images for different wavelengths (indicated by the green diamonds in the spectrum) across the Brγ line. The frames are individually normalized, the minimum brightness corresponds always to 5% of the maximum brightness. The images reveal the complex morphology of the primary wind and its interaction with the wind from the hidden secondary star.
Current usage metrics show cumulative count of Article Views (full-text article views including HTML views, PDF and ePub downloads, according to the available data) and Abstracts Views on Vision4Press platform.
Data correspond to usage on the plateform after 2015. The current usage metrics is available 48-96 hours after online publication and is updated daily on week days.
Initial download of the metrics may take a while.