Fig. 17
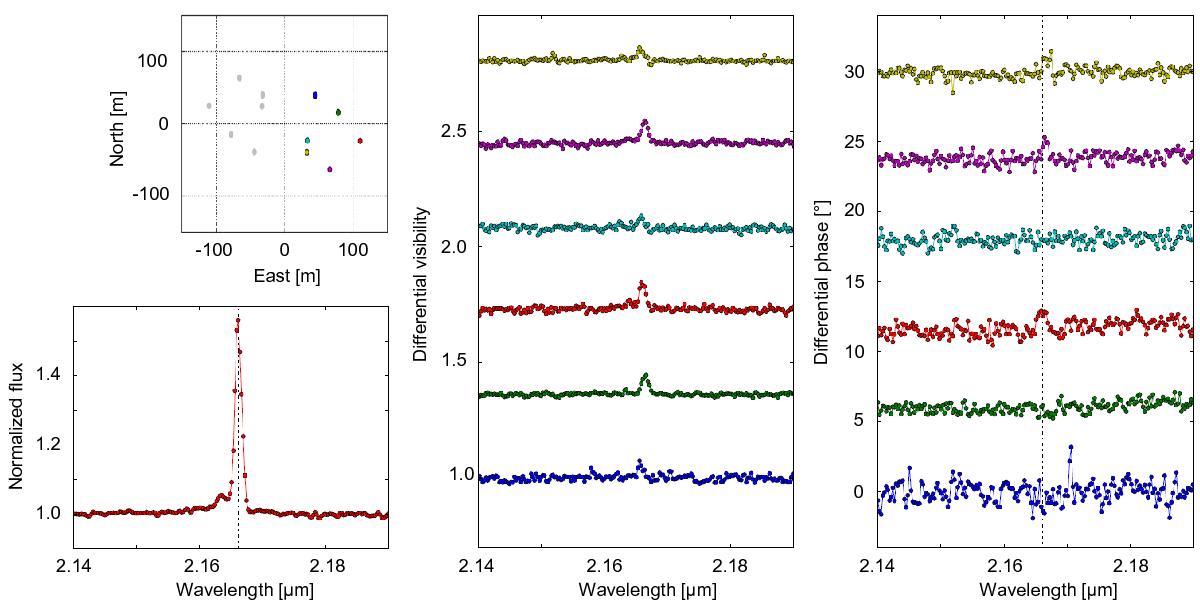
Spectro-differential interferometry of the T Tauri star S CrA North: the lower left panel shows the spectrum around the double-peaked hydrogen Brγ emission line. The middle and right panels display the observed differential visibilities and phases, respectively, for the six UT baselines depicted on the top left. The asymmetry and velocity offsets in the visibilities of the Brγ line at short baselines and the more symmetric visibility spectrum at long baselines point towards two different structures in the ionized gas of the innermost accretion and ejection region of T Tauri stars.
Current usage metrics show cumulative count of Article Views (full-text article views including HTML views, PDF and ePub downloads, according to the available data) and Abstracts Views on Vision4Press platform.
Data correspond to usage on the plateform after 2015. The current usage metrics is available 48-96 hours after online publication and is updated daily on week days.
Initial download of the metrics may take a while.