Fig. 10
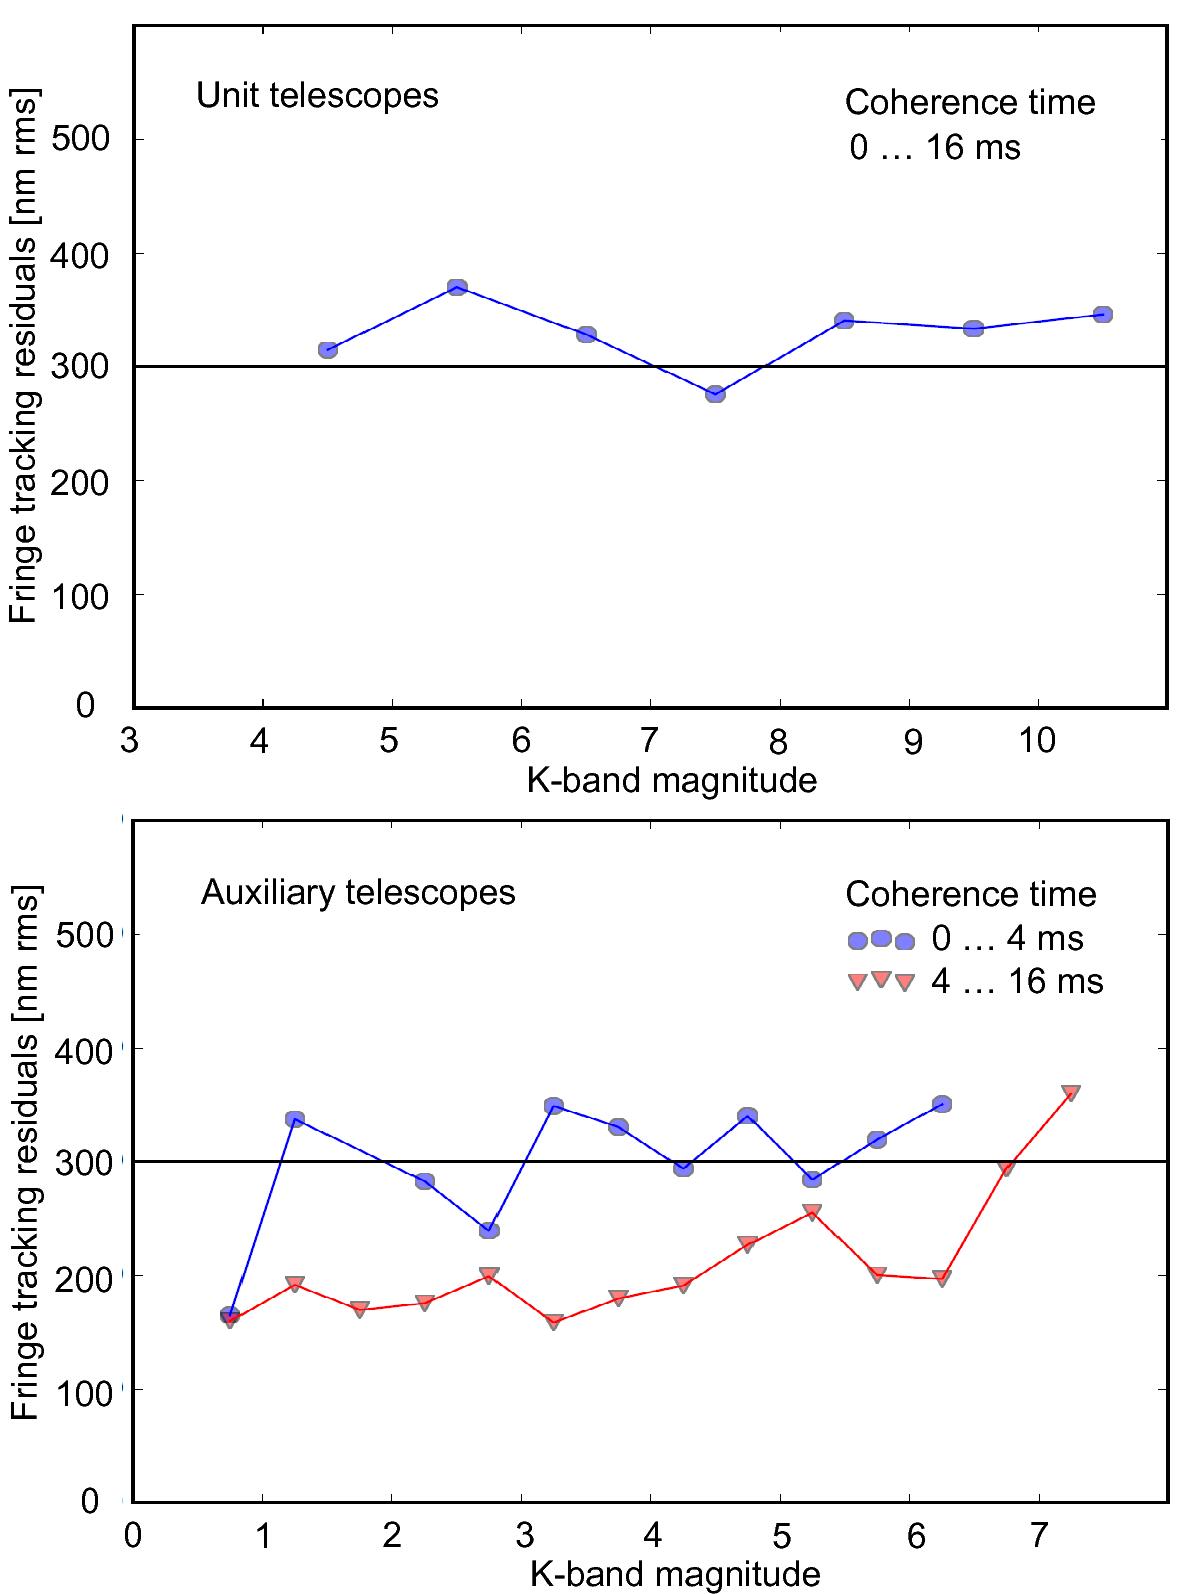
Fringe-tracking performance: the figures show the fringe-tracking residuals as a function of the reference stars’ K-band correlated magnitude for UTs (top) and ATs (bottom), respectively. The horizontal lines indicate residuals of 300 nm rms, for which the fringe contrast in long exposures is reduced by ~30% in the K-band. For the ATs, we plot the fringe-tracking residuals separately for good seeing with long atmospheric coherence times τ0> 4 ms (red), and for short coherence times τ0< 4 ms (blue). We do not have enough statistics to make this distinction for the UTs. The OPD residuals for long coherence times are typically 200 nm and 300 nm rms, the limiting magnitudes around mK ≈ 7 mag and mK ≈ 10 mag for the ATs and UTs, respectively.
Current usage metrics show cumulative count of Article Views (full-text article views including HTML views, PDF and ePub downloads, according to the available data) and Abstracts Views on Vision4Press platform.
Data correspond to usage on the plateform after 2015. The current usage metrics is available 48-96 hours after online publication and is updated daily on week days.
Initial download of the metrics may take a while.