Fig. 3
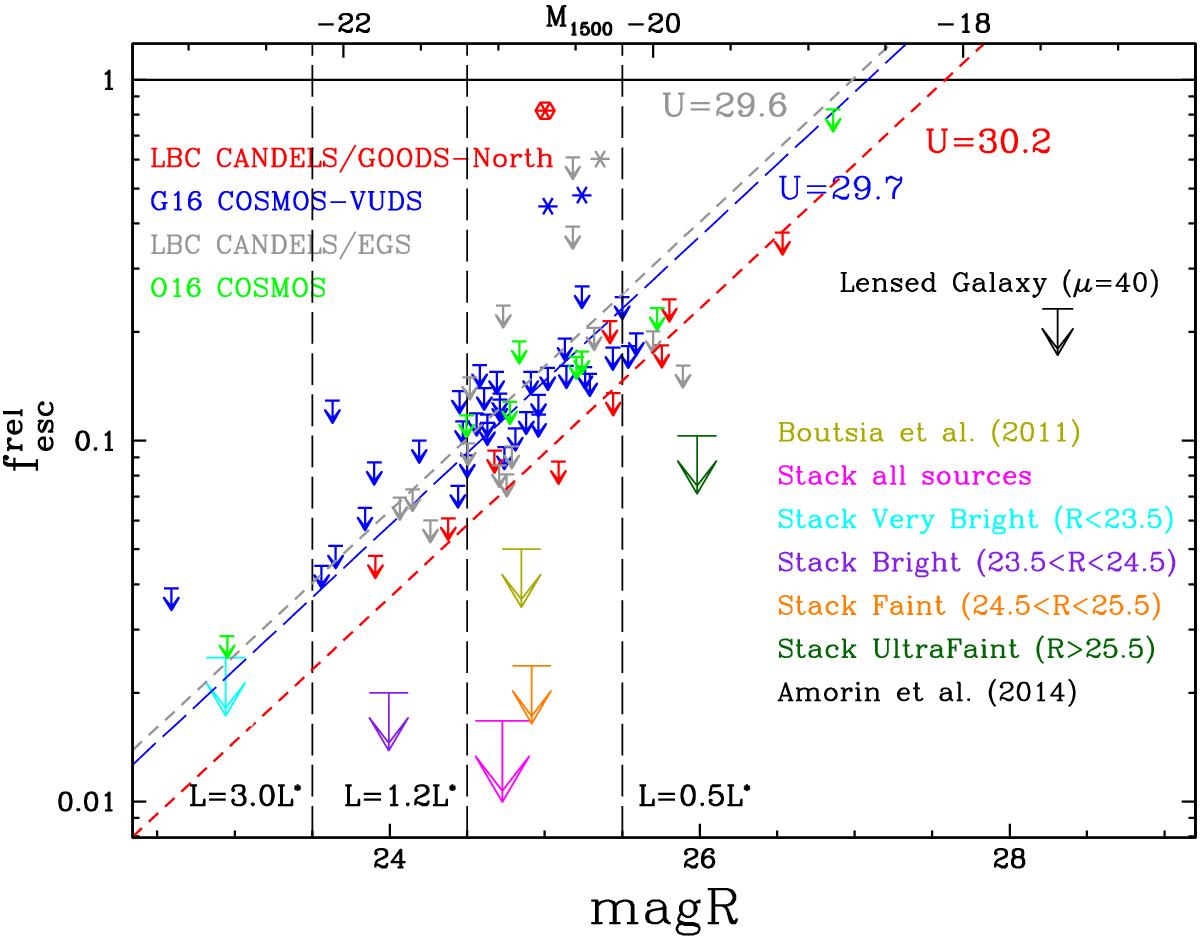
Measured values and the upper limits at 1σ for the LyC relative escape fraction of galaxies at z ~ 3.3 in the COSMOS (blue, green), EGS (gray), and CANDELS/GOODS-North fields (red). Small descending arrows show the upper limits of ![]() associated with individual galaxies. Asterisks show the galaxies detected in the U band (i.e., LyC emission) above 1σ. The red hexagon indicates a likely foreground contamination in the CANDELS/GOODS-North field, associated with galaxy ID = 16479. The lensed galaxy from Amorin et al. (2014), magnified by a factor μ = 40 ± 1, is represented by a black arrow at its intrinsic (de-magnified) magnitude R = 28.31. The gray, blue, and red dashed lines show the dependency of the escape fraction on the R-band magnitude derived by adopting the 1σ depth of the U band in the EGS, COSMOS, and CANDELS/GOODS-North fields, respectively. The large arrows (cyan, purple, magenta, orange, gold, dark green) represent the limits to
associated with individual galaxies. Asterisks show the galaxies detected in the U band (i.e., LyC emission) above 1σ. The red hexagon indicates a likely foreground contamination in the CANDELS/GOODS-North field, associated with galaxy ID = 16479. The lensed galaxy from Amorin et al. (2014), magnified by a factor μ = 40 ± 1, is represented by a black arrow at its intrinsic (de-magnified) magnitude R = 28.31. The gray, blue, and red dashed lines show the dependency of the escape fraction on the R-band magnitude derived by adopting the 1σ depth of the U band in the EGS, COSMOS, and CANDELS/GOODS-North fields, respectively. The large arrows (cyan, purple, magenta, orange, gold, dark green) represent the limits to ![]() derived by stacking the z ~ 3.3 galaxies from Grazian et al. (2016) and from this paper in different R-band magnitude intervals.
derived by stacking the z ~ 3.3 galaxies from Grazian et al. (2016) and from this paper in different R-band magnitude intervals.
Current usage metrics show cumulative count of Article Views (full-text article views including HTML views, PDF and ePub downloads, according to the available data) and Abstracts Views on Vision4Press platform.
Data correspond to usage on the plateform after 2015. The current usage metrics is available 48-96 hours after online publication and is updated daily on week days.
Initial download of the metrics may take a while.