Free Access
Fig. 5
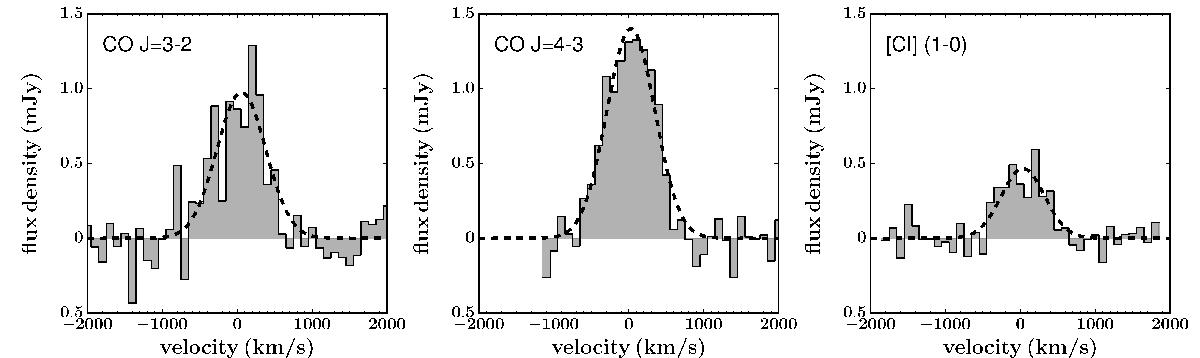
Integrated flux density of the CO J = 3–2 (left), CO J = 4–3 (middle), and [CI] 1–0 (right) emission lines in 3D-HST GS30274. The dashed line marks the gaussian fit to the density profile. All the lines are clearly detected and can be well fitted by a Gaussian.
Current usage metrics show cumulative count of Article Views (full-text article views including HTML views, PDF and ePub downloads, according to the available data) and Abstracts Views on Vision4Press platform.
Data correspond to usage on the plateform after 2015. The current usage metrics is available 48-96 hours after online publication and is updated daily on week days.
Initial download of the metrics may take a while.