Fig. 2
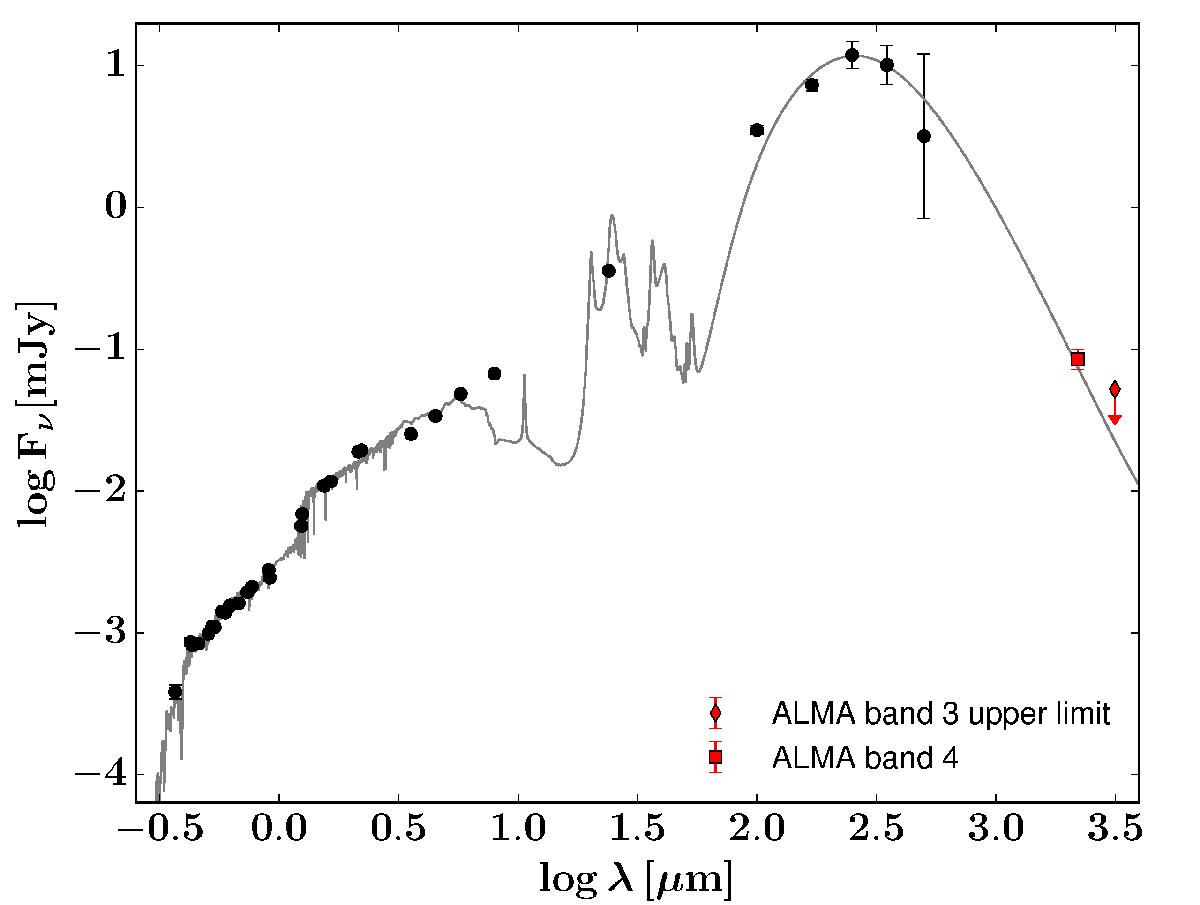
Multi-wavelength spectral energy distribution of 3D-HST GS30274. The best fit from the MAGPHYS analysis is plotted as a line. The optical, NIR, Herschel measurements are shown as bold circles. The ALMA band 4 continuum detection is presented as a red square. The red diamond represents the three sigma upper limit on the ALMA band 3 continuum.
Current usage metrics show cumulative count of Article Views (full-text article views including HTML views, PDF and ePub downloads, according to the available data) and Abstracts Views on Vision4Press platform.
Data correspond to usage on the plateform after 2015. The current usage metrics is available 48-96 hours after online publication and is updated daily on week days.
Initial download of the metrics may take a while.