Fig. 8
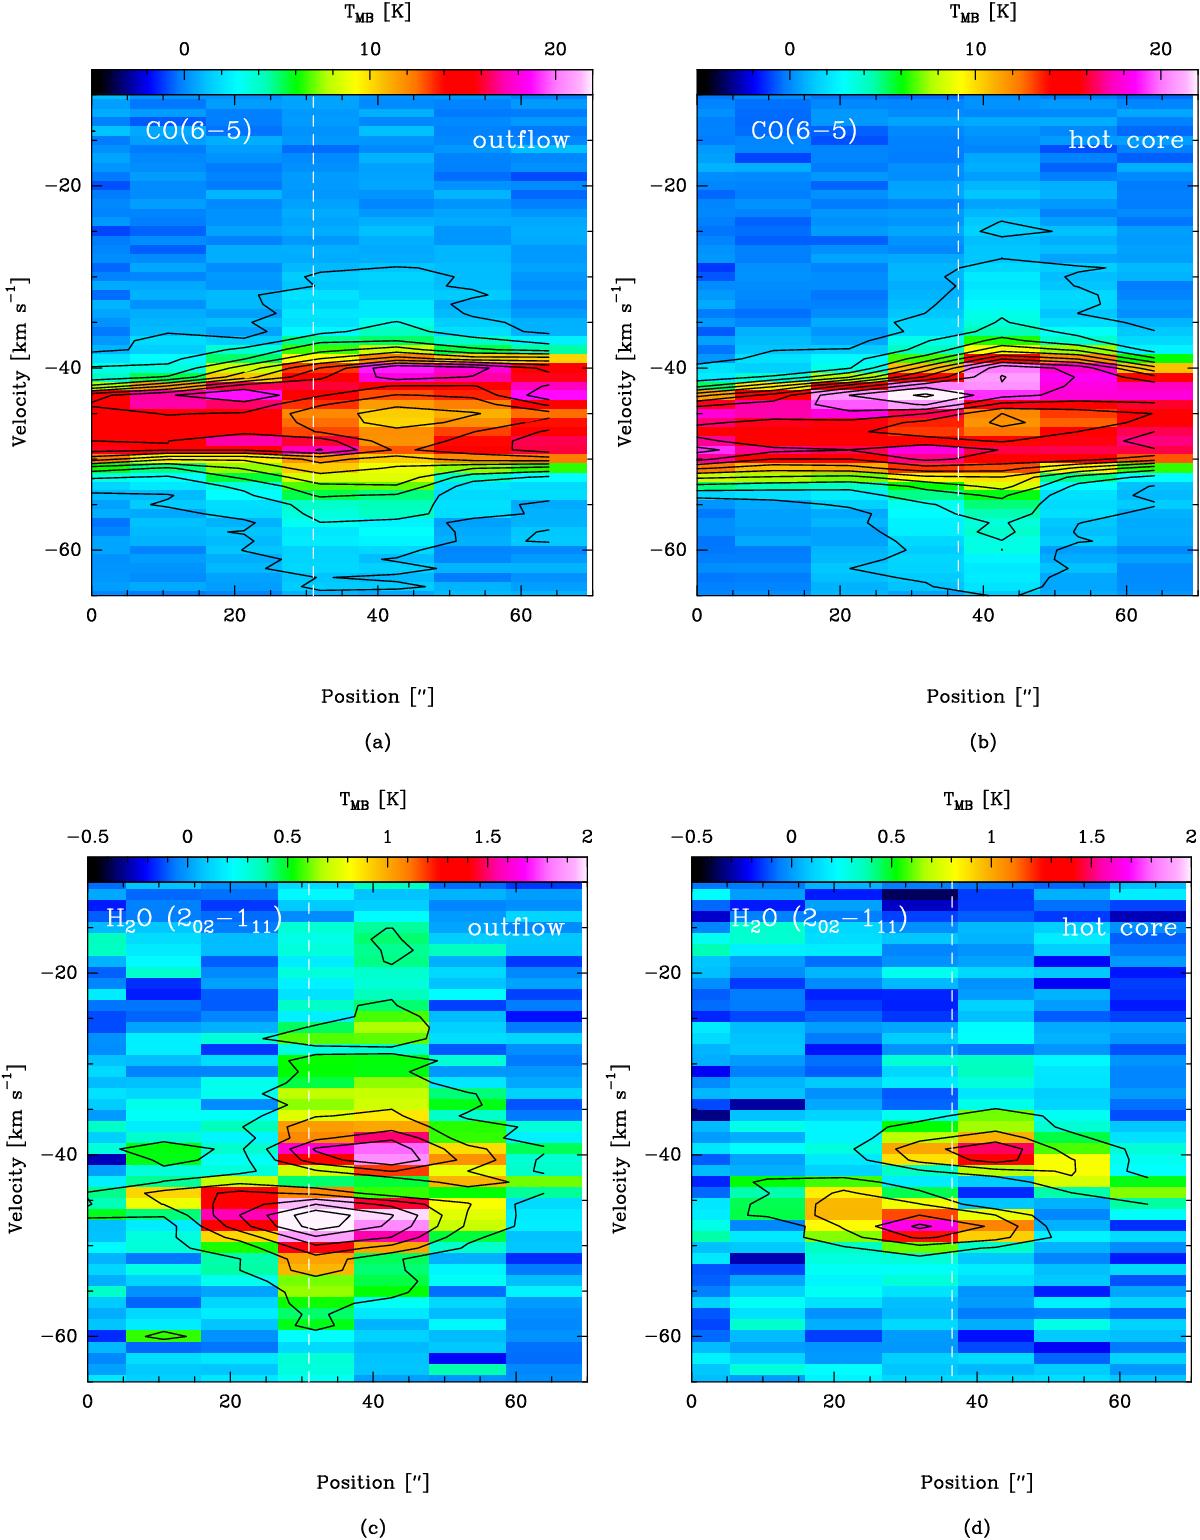
Top: color scale and contours show the P-V diagram of the CO(6–5) transition computed along a vertical cut passing through the outflow a) and the hot core position b). Bottom: color scale and contours show the P-V diagram of the 202−111 H2O line computed along a vertical cut passing through the outflow c) and the hot core position d). The cut through the outflow position is from ![]() to
to ![]() , the cut through the hot core from
, the cut through the hot core from ![]() to
to ![]() . Offset positions increase along the direction of the cuts. Contours are from 3σ in steps of 3σ for H2O, and in steps of 5σ for CO.
. Offset positions increase along the direction of the cuts. Contours are from 3σ in steps of 3σ for H2O, and in steps of 5σ for CO.
Current usage metrics show cumulative count of Article Views (full-text article views including HTML views, PDF and ePub downloads, according to the available data) and Abstracts Views on Vision4Press platform.
Data correspond to usage on the plateform after 2015. The current usage metrics is available 48-96 hours after online publication and is updated daily on week days.
Initial download of the metrics may take a while.