Fig. 7
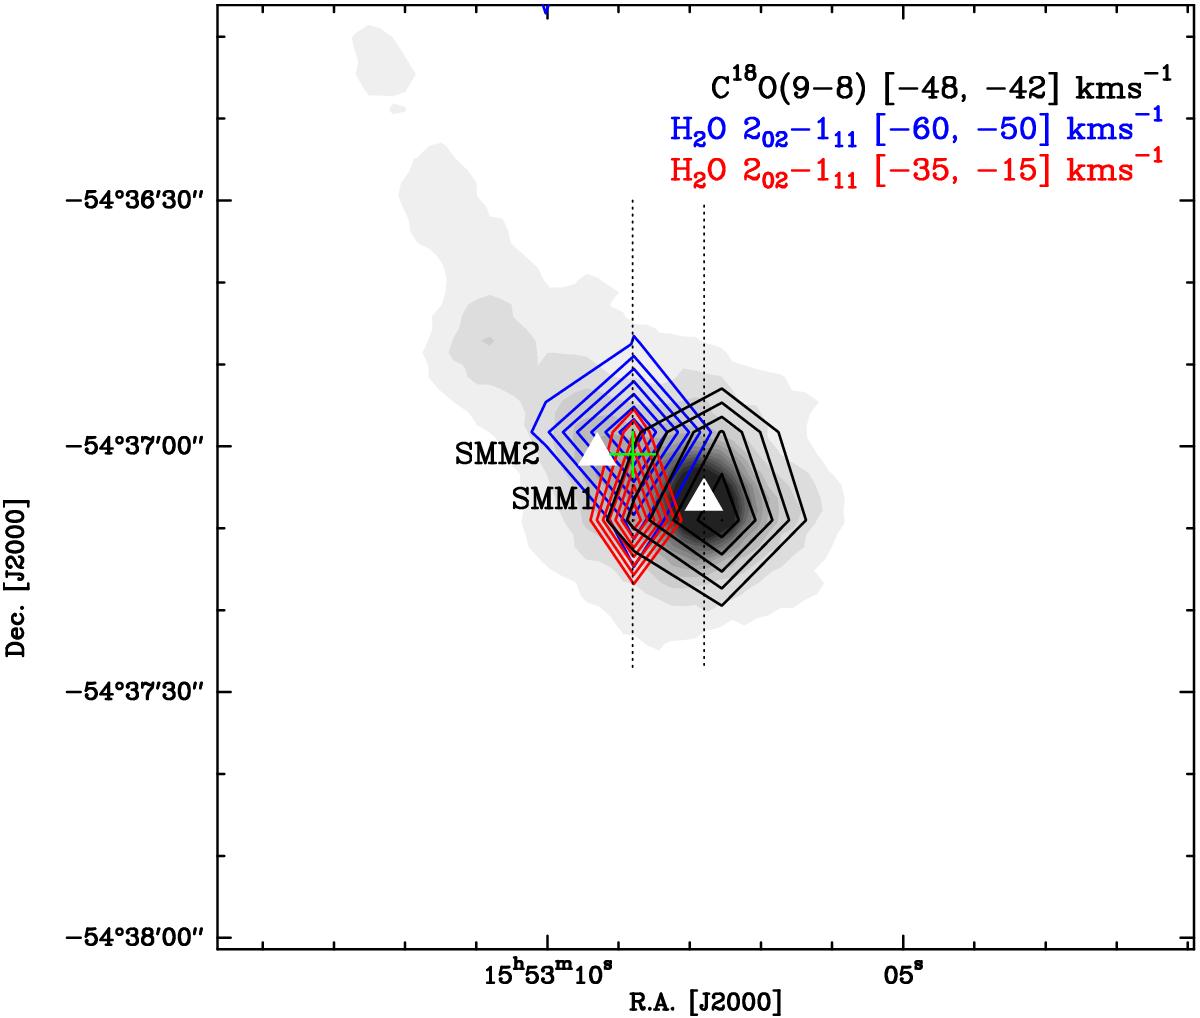
Integrated intensity map of the p-H2O 202-111 line in the blue- ([−60,−50 ] km s-1, blue contours from 30% of the peak emission in steps of 10%) and redshifted ([−35,−15 ] km s-1, red contours from 30% of the peak emission in steps of 10%) velocity ranges toward the IRDC region. The gray contours represent the integrated intensity of C18O(9–8) ([−48,−42 ] km s-1, from 50% of the peak emission in steps of 10%). The white triangles mark SMM1 and SMM2, the green cross the position observed in the single-pointing HIFI observations (labeled as outflow in Fig. 8.) The dotted lines outline the cuts used to derive the P-V diagrams discussed in Sect. 3.2.1).
Current usage metrics show cumulative count of Article Views (full-text article views including HTML views, PDF and ePub downloads, according to the available data) and Abstracts Views on Vision4Press platform.
Data correspond to usage on the plateform after 2015. The current usage metrics is available 48-96 hours after online publication and is updated daily on week days.
Initial download of the metrics may take a while.