Fig. 6
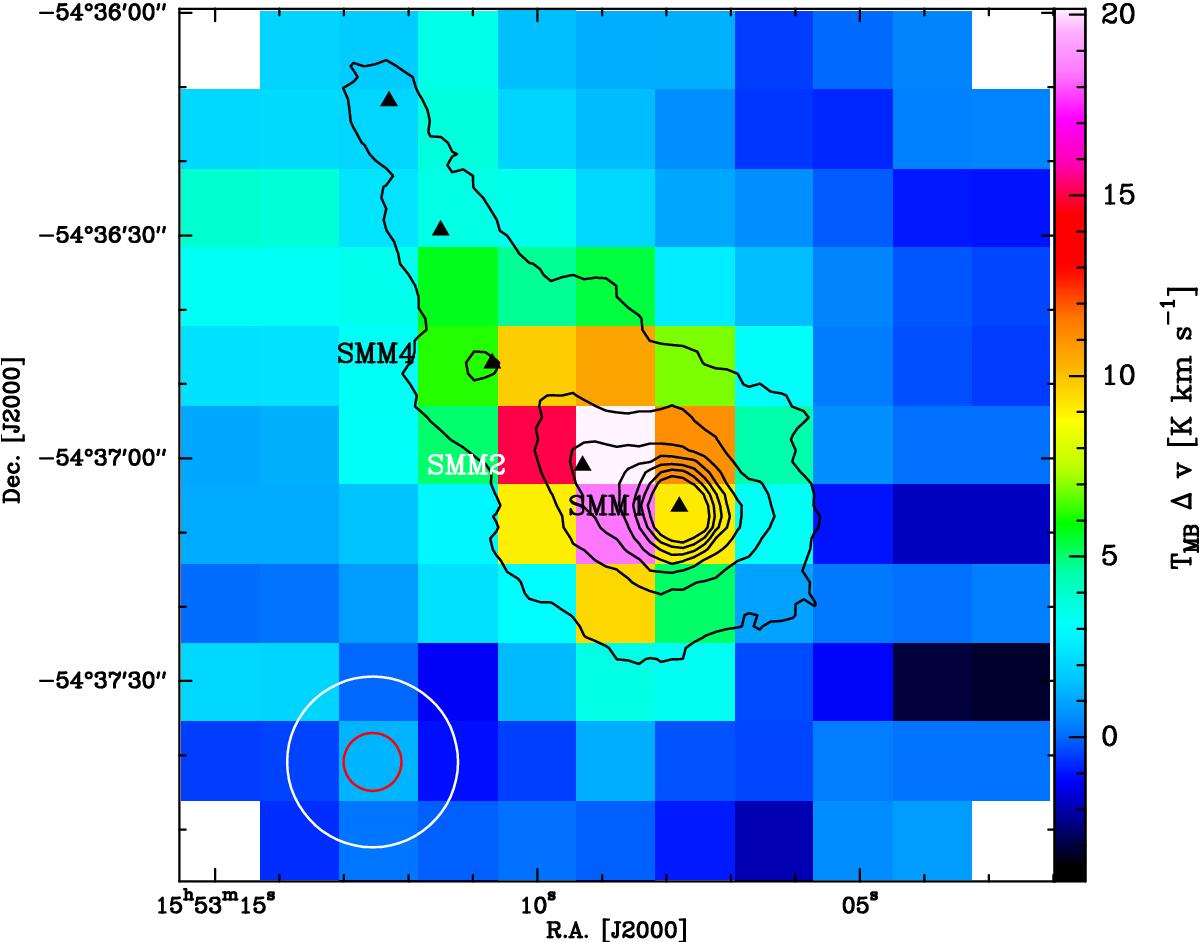
Integrated HIFI intensity map of the p-H2O 202-111 line ([−50,−38 ] km s-1) toward the IRDC region (color image). The black contours show the SABOCA continuum emission at 350 μm from 5% of the peak flux in steps of 10%. The triangles mark the positions of the submillimeter continuum peaks reported in Table 3. Beams of the observations of the p-H2O 202-111 line (white circle) and of the 350 μm continuum (red circle) are shown in the bottom left corner.
Current usage metrics show cumulative count of Article Views (full-text article views including HTML views, PDF and ePub downloads, according to the available data) and Abstracts Views on Vision4Press platform.
Data correspond to usage on the plateform after 2015. The current usage metrics is available 48-96 hours after online publication and is updated daily on week days.
Initial download of the metrics may take a while.