Fig. 5
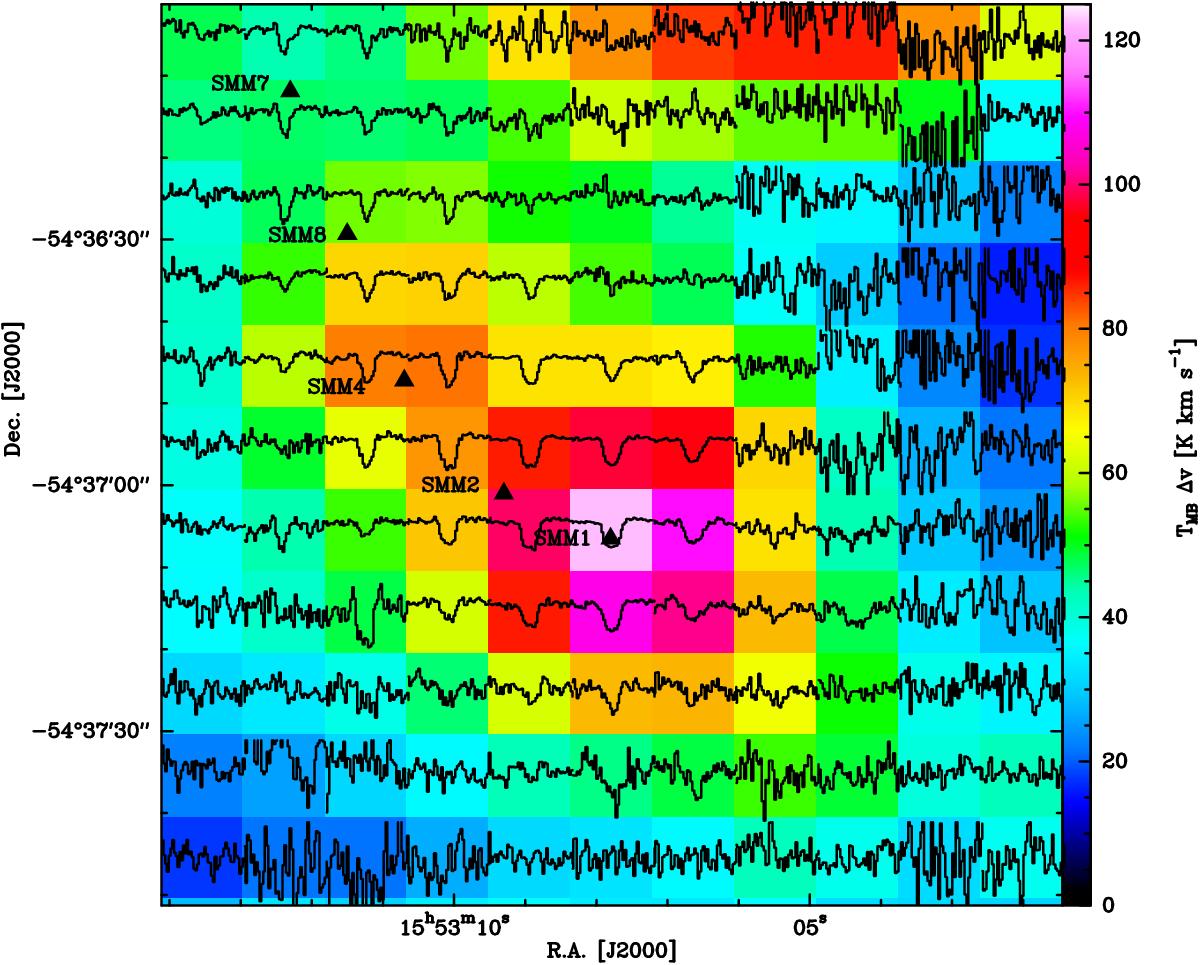
Spectral HIFI map of the line-to-continuum ratio of the 111 → 000 p-H2O line toward the IRDC region overlaid on the 13CO(6–5) integrated emission (color image). The temperature axis ranges from –1 to 1.5 K, the velocity axis ranges from –65 to –35 km s-1. The 13CO(6–5) data are smoothed to the resolution of the H2O map. The black triangles mark the positions of the peaks of the 450 μm continuum emission.
Current usage metrics show cumulative count of Article Views (full-text article views including HTML views, PDF and ePub downloads, according to the available data) and Abstracts Views on Vision4Press platform.
Data correspond to usage on the plateform after 2015. The current usage metrics is available 48-96 hours after online publication and is updated daily on week days.
Initial download of the metrics may take a while.