Fig. 4
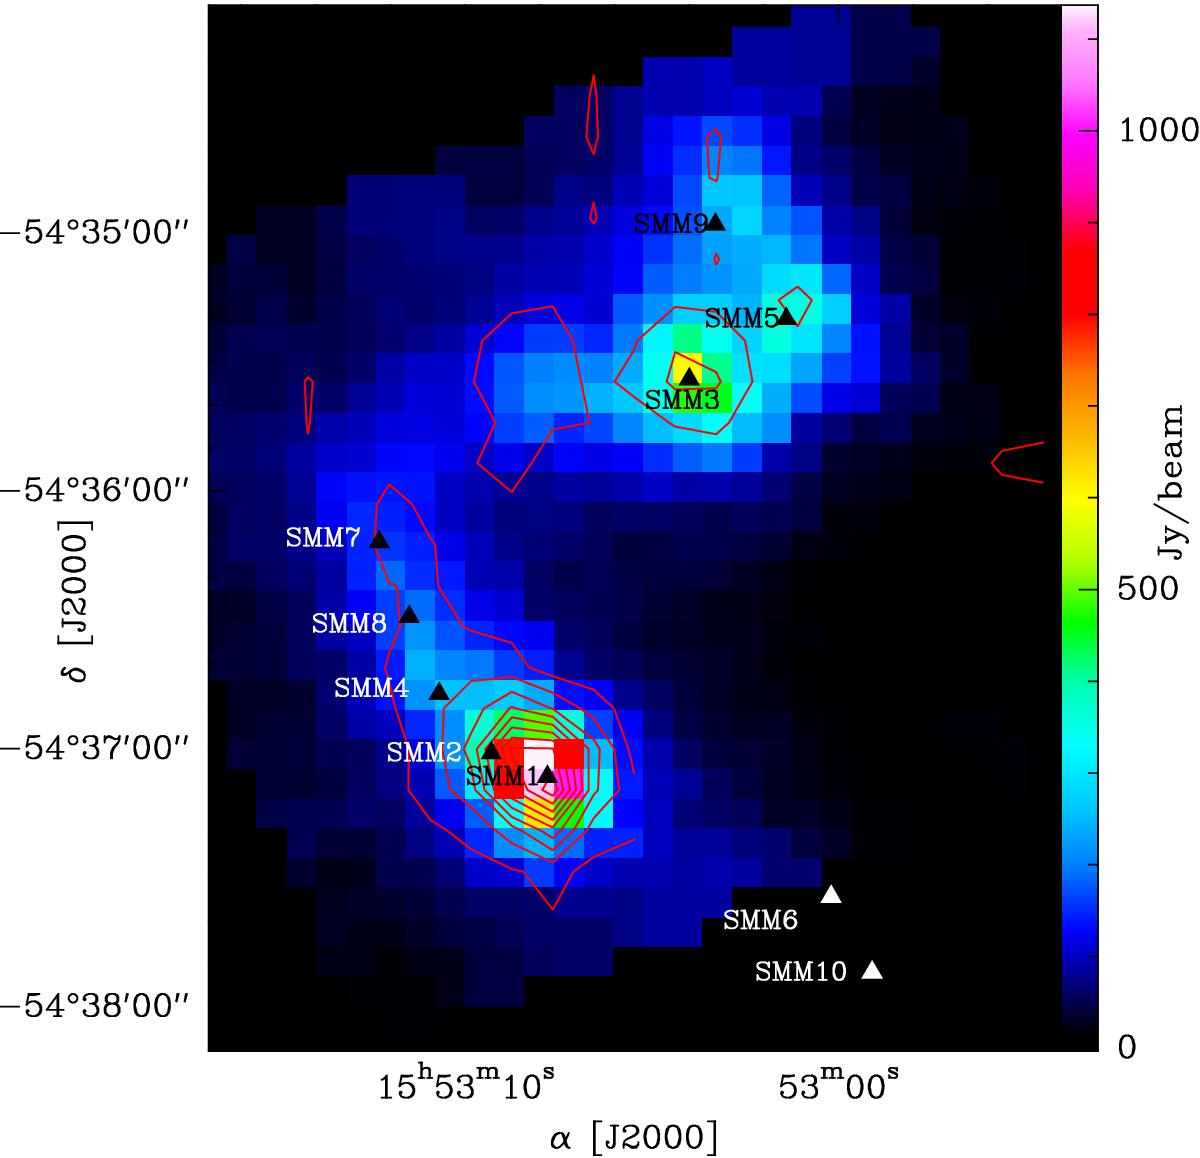
Distribution of the continuum emission at 179 μm in G327.3–0.6 (color scale). The solid red contours represent the distribution of the absorption in the 111 → 000 p-H2O line, integrated in the velocity range vLSR = [−55,−37] km s-1 (from –3σ, –4.5 K km s-1, in steps of –3σ). Labels are the peaks of the 450 μm continuum emission from Minier et al. (2009).
Current usage metrics show cumulative count of Article Views (full-text article views including HTML views, PDF and ePub downloads, according to the available data) and Abstracts Views on Vision4Press platform.
Data correspond to usage on the plateform after 2015. The current usage metrics is available 48-96 hours after online publication and is updated daily on week days.
Initial download of the metrics may take a while.