Fig. 3
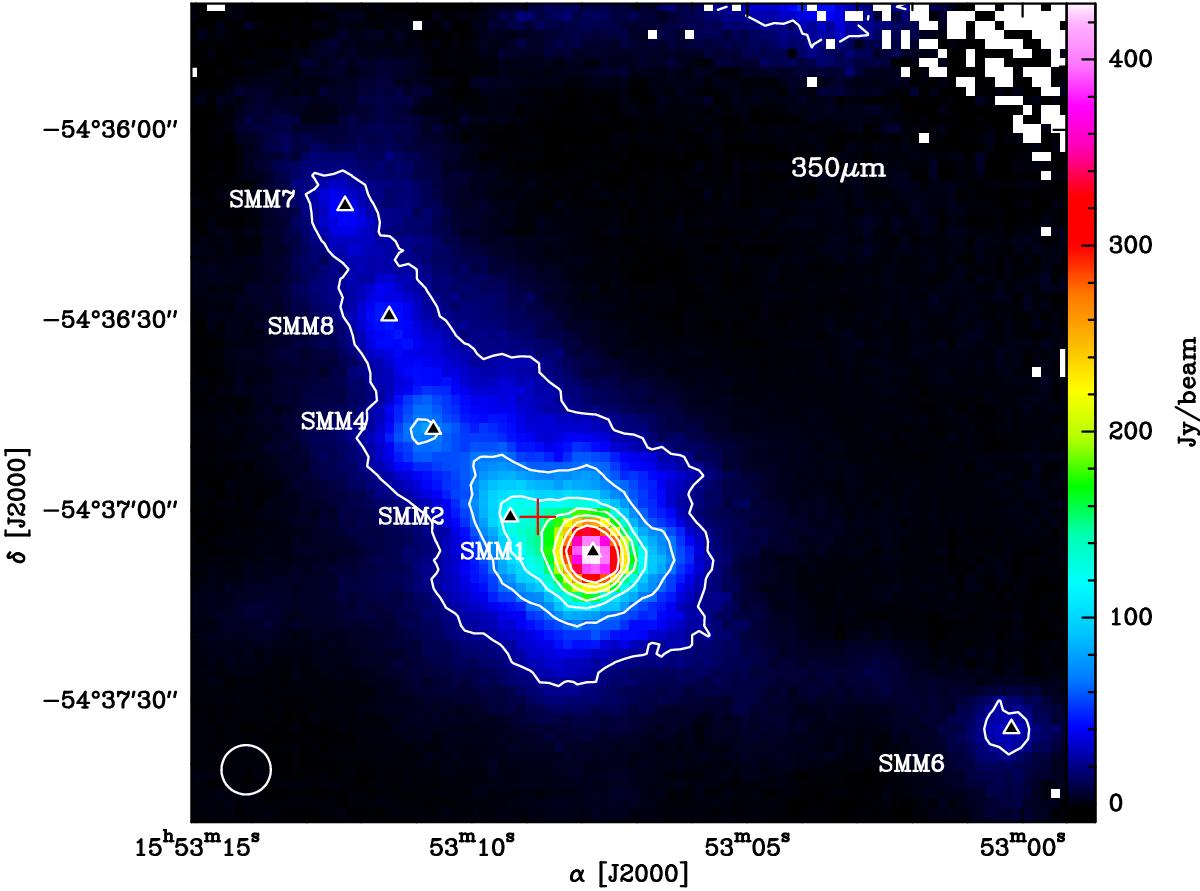
Distribution of the SABOCA continuum emission at 350 μm along the infrared dark cloud in G327.3–0.6. Contours are from 5% of the peak flux in steps of 10%. The triangles mark the positions of the submillimeter continuum peaks reported in Table 3. The red cross marks the position observed for the single pointing HIFI observations. The white circle in the bottom left corner shows the beam of the SABOCA observations.
Current usage metrics show cumulative count of Article Views (full-text article views including HTML views, PDF and ePub downloads, according to the available data) and Abstracts Views on Vision4Press platform.
Data correspond to usage on the plateform after 2015. The current usage metrics is available 48-96 hours after online publication and is updated daily on week days.
Initial download of the metrics may take a while.