Fig. 2
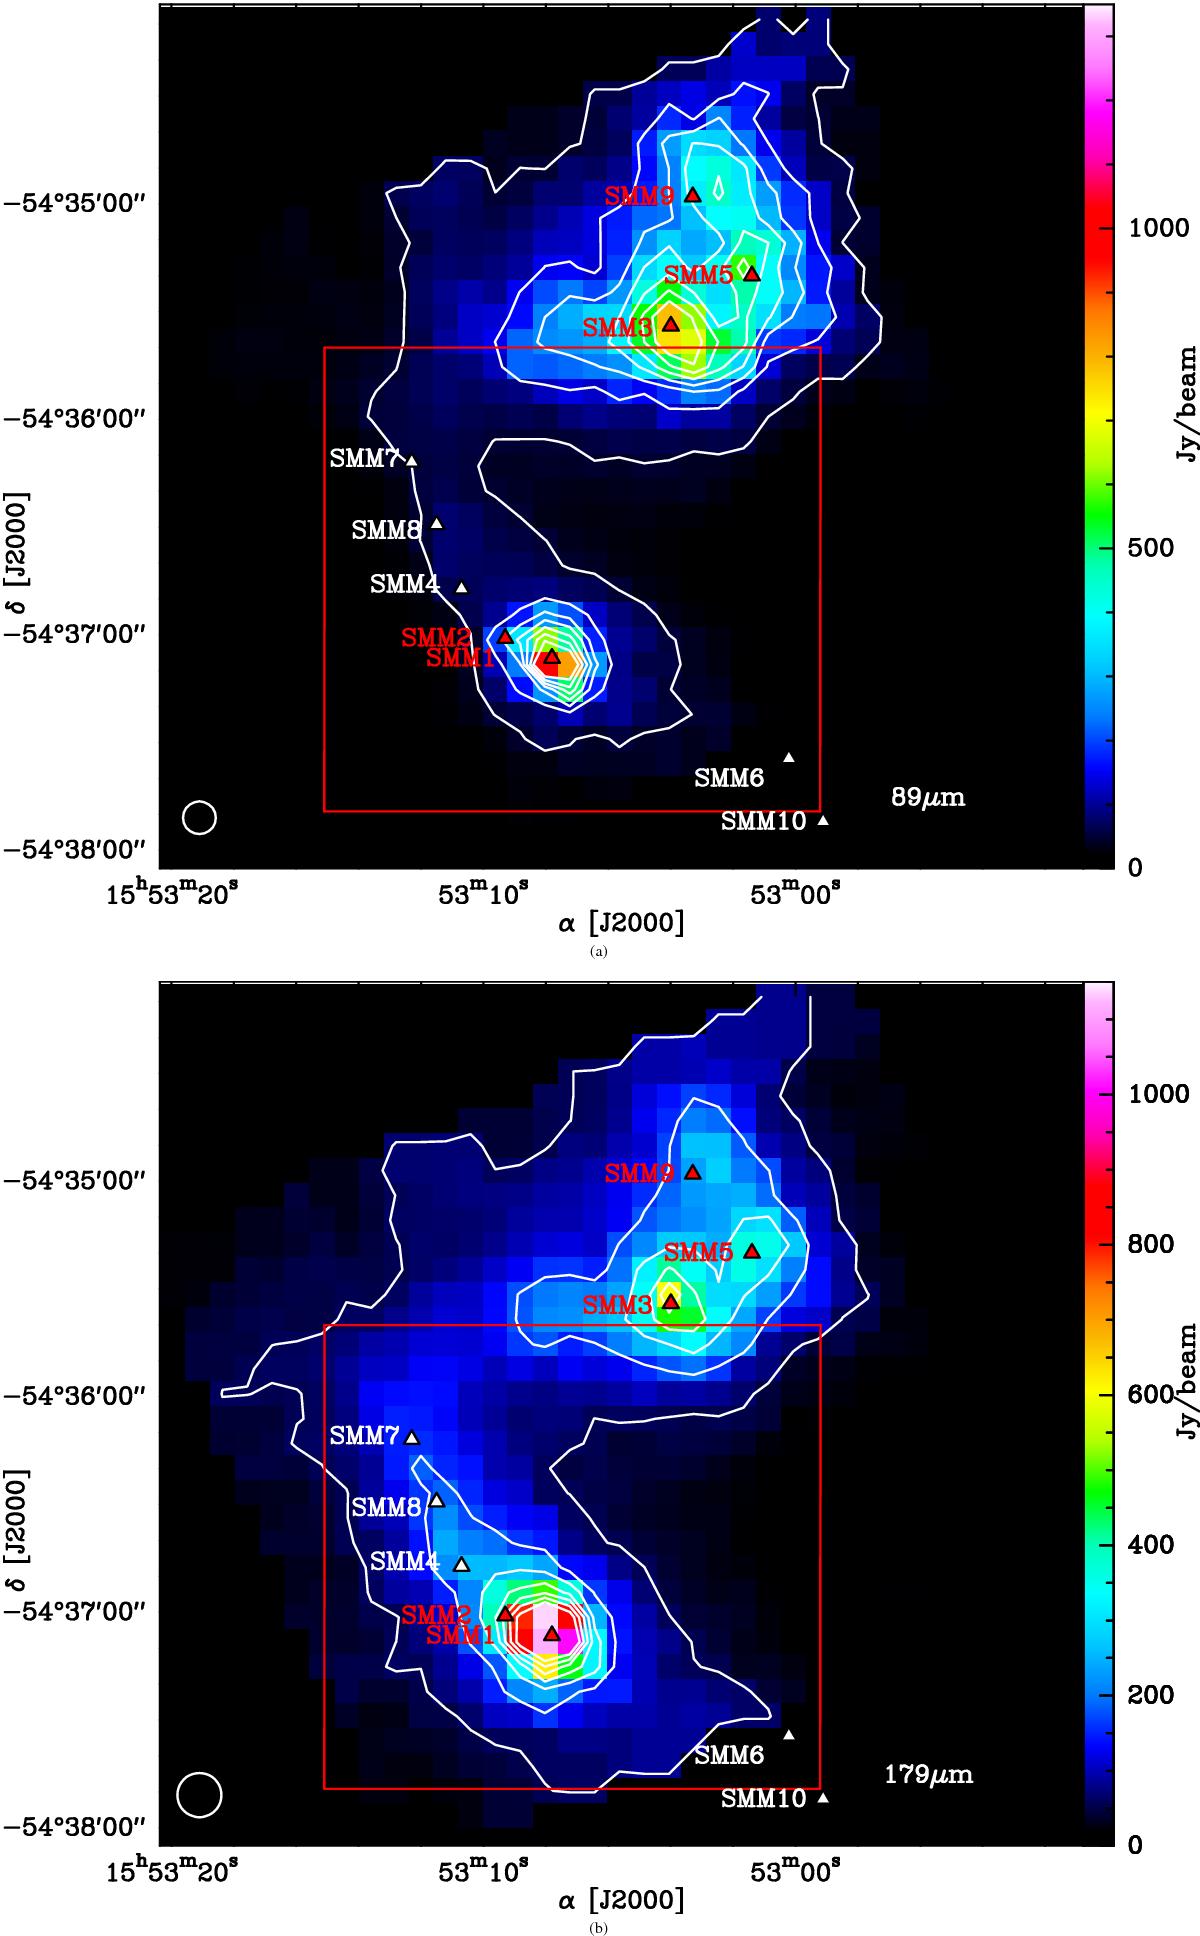
Color scale and white contours are the PACS continuum image of G327.36–0.6 at 89 (top panel, resolution is 9.1″) and 179 μm (bottom panel, resolution is 12.3″). Contours are from 5% of the peak flux in steps of 10%. The triangles mark the positions of the submillimeter continuum peaks reported in Table 3. The red box outlines the area plotted in Fig. 3.
Current usage metrics show cumulative count of Article Views (full-text article views including HTML views, PDF and ePub downloads, according to the available data) and Abstracts Views on Vision4Press platform.
Data correspond to usage on the plateform after 2015. The current usage metrics is available 48-96 hours after online publication and is updated daily on week days.
Initial download of the metrics may take a while.