Free Access
Fig. 18
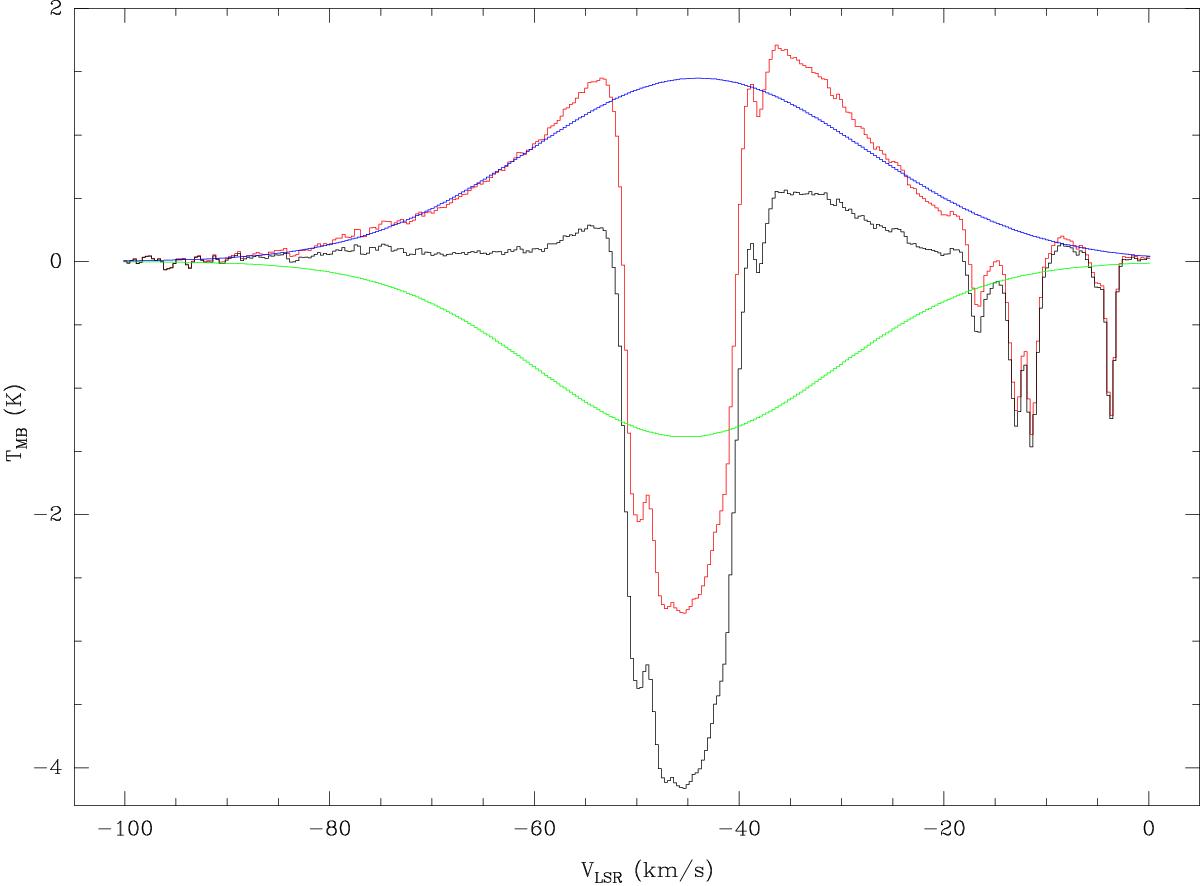
Resulting line profile (in red) of the p-H2O 111–000 line corrected from the absorption shown in green and derived from the p-H218O 111–000 Gaussian line fitting. The original spectra are shown in black. The blue curve is the Gaussian fitting of the outflow.
Current usage metrics show cumulative count of Article Views (full-text article views including HTML views, PDF and ePub downloads, according to the available data) and Abstracts Views on Vision4Press platform.
Data correspond to usage on the plateform after 2015. The current usage metrics is available 48-96 hours after online publication and is updated daily on week days.
Initial download of the metrics may take a while.