Free Access
Fig. 15
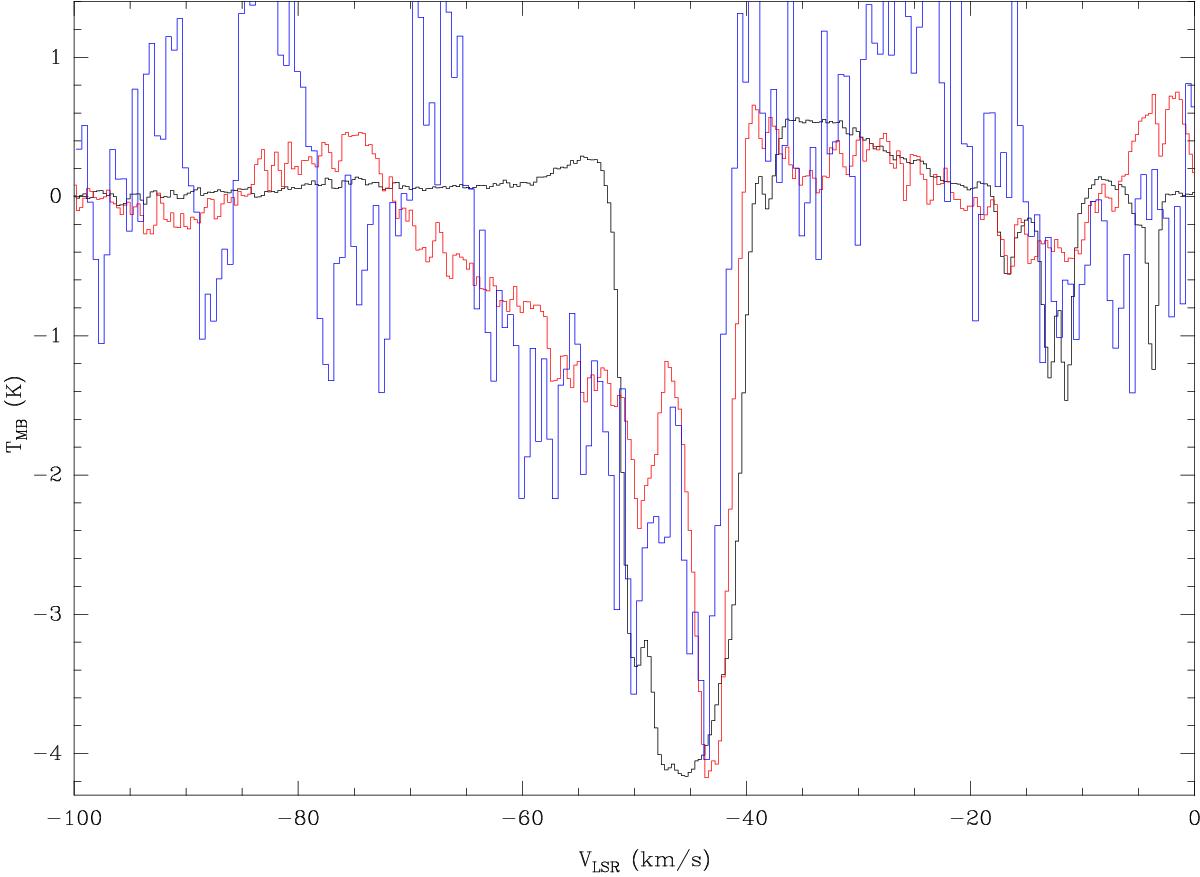
Spectra of p-H218O 111–000 (× 6.2, in red) and p-H217O 111–000 (× 21, in blue) lines overplotted on the p-H2O 111–000 spectrum (in black). The spectra have been smoothed to 0.3 km s-1 (1.4 km s-1 for the H217O spectrum).
Current usage metrics show cumulative count of Article Views (full-text article views including HTML views, PDF and ePub downloads, according to the available data) and Abstracts Views on Vision4Press platform.
Data correspond to usage on the plateform after 2015. The current usage metrics is available 48-96 hours after online publication and is updated daily on week days.
Initial download of the metrics may take a while.