Fig. 12
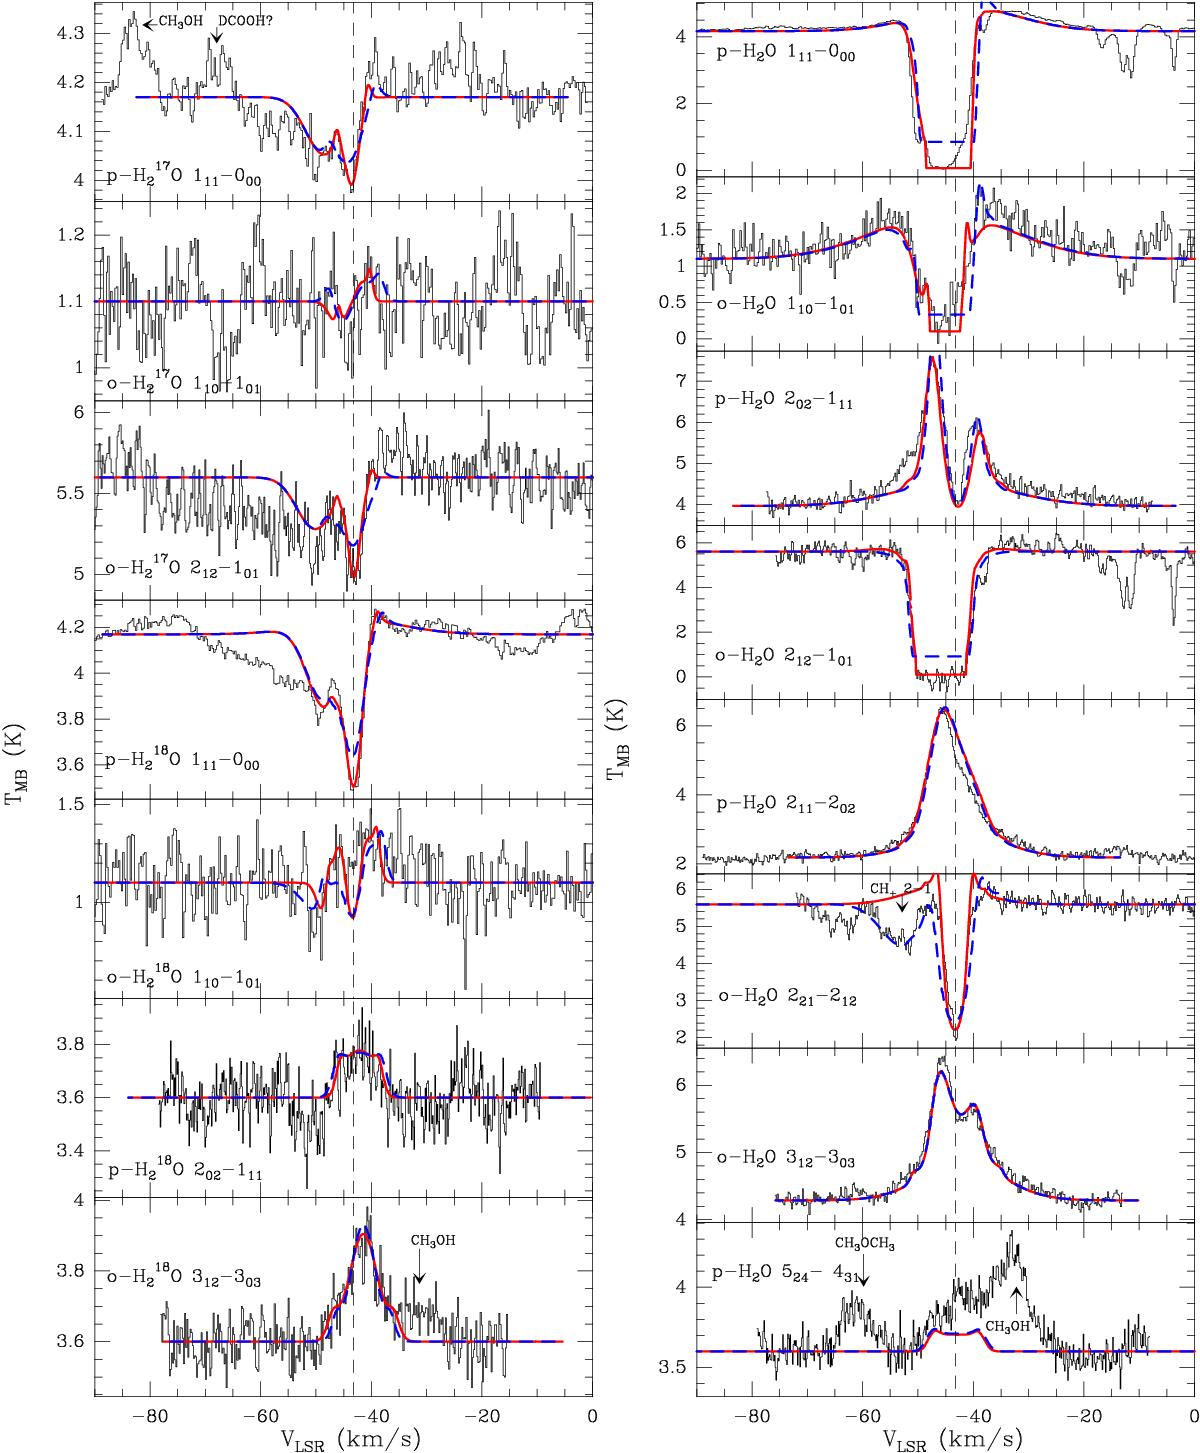
HIFI spectra of the H217O/H218O (left) and H216O (right) lines (in black), with continuum for G327.3–0.6 hot core pointed position. The best-fit model with varying (from line to line) and constant (2.6 km s-1) turbulent velocity is shown as a red and dashed blue line above the spectra. Vertical dotted lines indicate the VLSR (–43.2 km s-1 from the line modeling). The spectra have been smoothed to 0.2 km s-1, and the continuum is divided by a factor of two.
Current usage metrics show cumulative count of Article Views (full-text article views including HTML views, PDF and ePub downloads, according to the available data) and Abstracts Views on Vision4Press platform.
Data correspond to usage on the plateform after 2015. The current usage metrics is available 48-96 hours after online publication and is updated daily on week days.
Initial download of the metrics may take a while.