Fig. 10
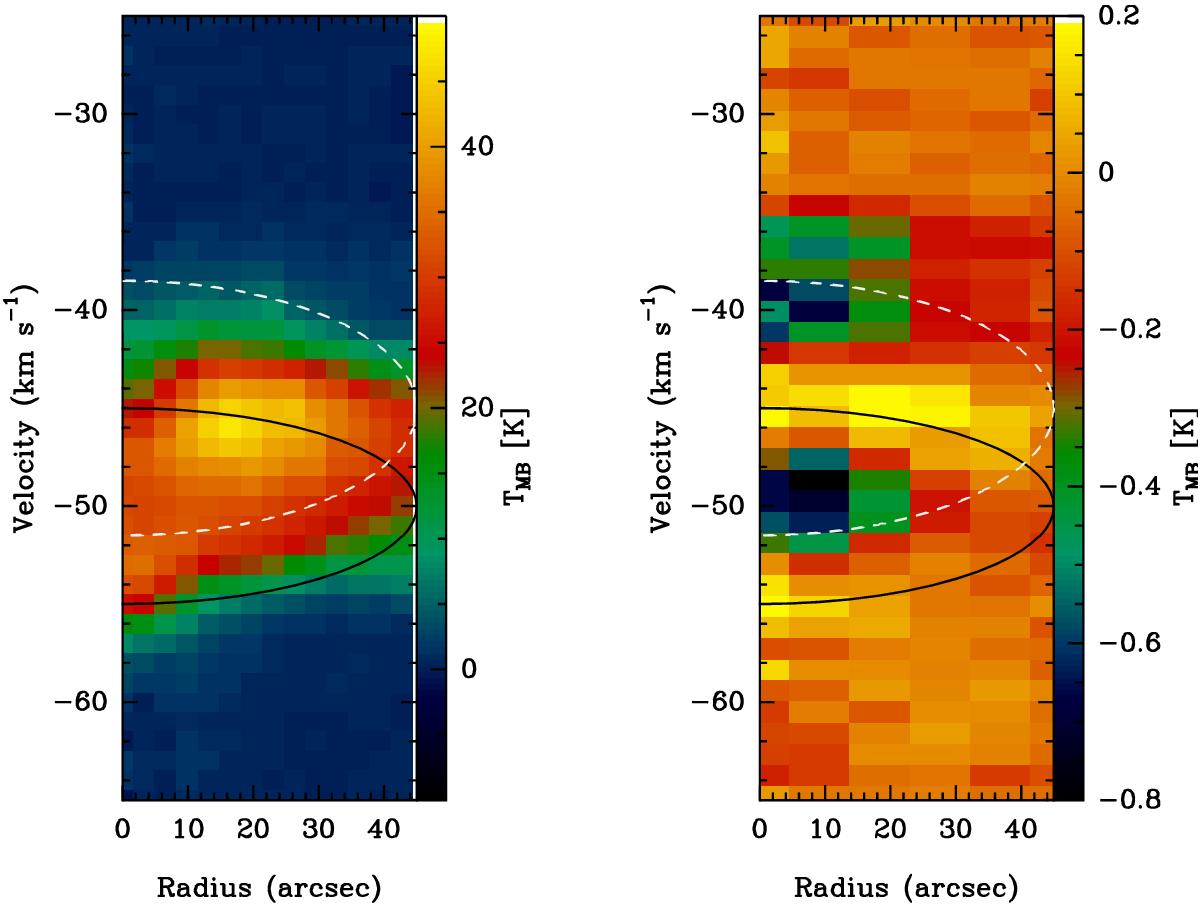
(r−v) diagrams of the Hii region G327.3–0.5 obtained from the 12CO(6–5) (left) and from the 111–000-p H2O (right) data cubes. The radius axis is the distance to the shell expansion center, chosen to be the peak of the cm continuum emission. The black solid half-ellipse represents an ideal shell in (r−v) diagram with an expansion velocity of 5 km s-1 centered on –50 km s-1, the dashed white half-ellipse an ideal shell with an expansion velocity of 6.5 km s-1 centered on –45 km s-1.
Current usage metrics show cumulative count of Article Views (full-text article views including HTML views, PDF and ePub downloads, according to the available data) and Abstracts Views on Vision4Press platform.
Data correspond to usage on the plateform after 2015. The current usage metrics is available 48-96 hours after online publication and is updated daily on week days.
Initial download of the metrics may take a while.