Free Access
Fig. 1
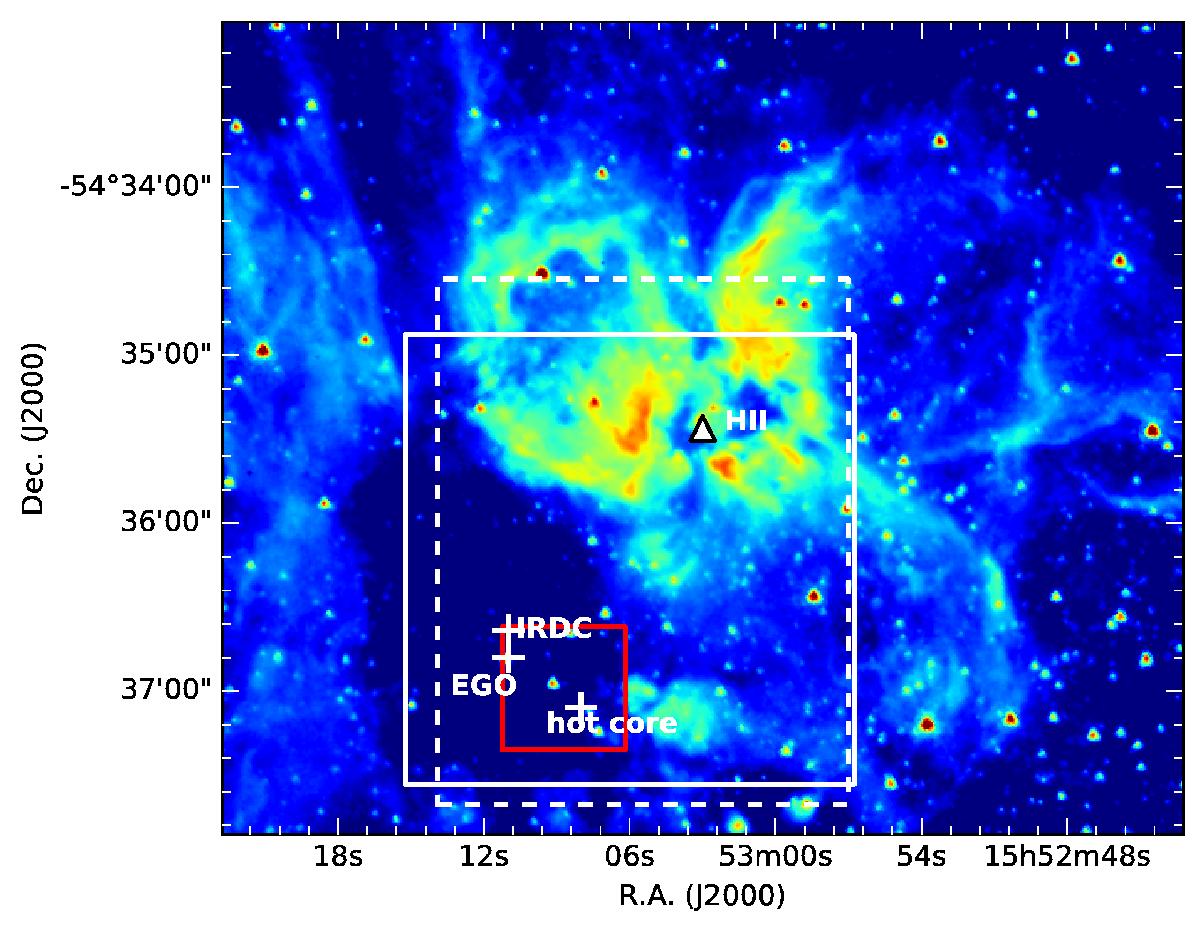
Large-scale Spitzer image at 3.6 μm of G327.36–0.6. The boxes show the areas mapped with PACS at 89 and 179 μm (solid white line), with HIFI at 1113 GHz (white dashed line), and at 987 GHz (red line). The white crosses and triangle mark the positions discussed in Paper I.
Current usage metrics show cumulative count of Article Views (full-text article views including HTML views, PDF and ePub downloads, according to the available data) and Abstracts Views on Vision4Press platform.
Data correspond to usage on the plateform after 2015. The current usage metrics is available 48-96 hours after online publication and is updated daily on week days.
Initial download of the metrics may take a while.