Fig. 7
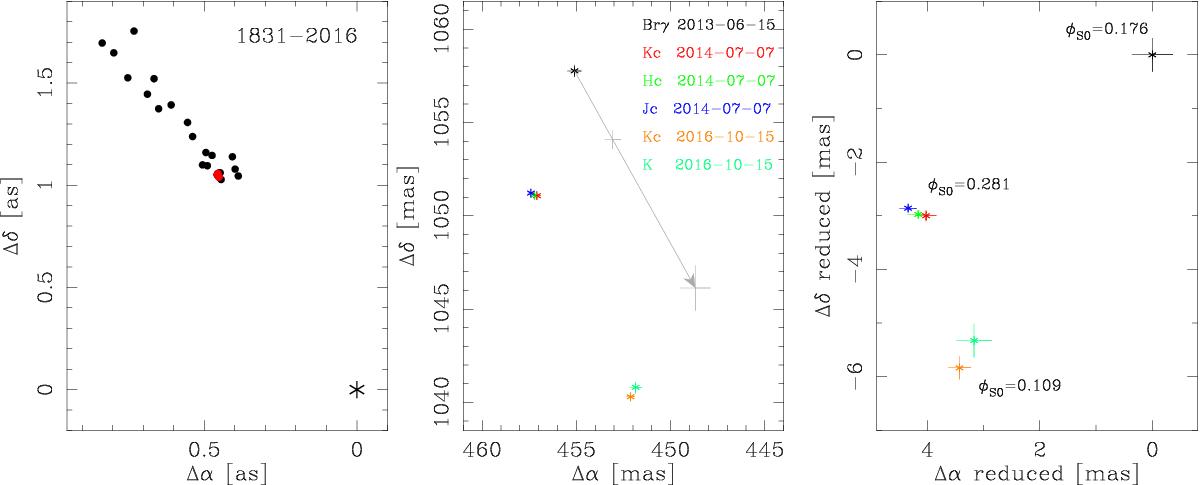
Astrometry of star A relatively to star B. Left: all data available from the WDS (black) and results from this work (red), on Δα/ Δδ plane, reconstructed from ρ and θ. The star B is set in (0, 0) and marked with an asterisk. One can see a gradual movement with an average rate of 1.9(2) mas/yr and 3.5(3) mas/yr in α and δ respectively. Middle: enlargement of our results, showing Keck II/NIRC2 observations (both archival and ours). Each measurement (date, filter) is denoted with a different colour. The grey arrow and crosses show the vector of the gradual orbital movement since 2013-06-15 and predicted relative positions in dates of other observations (with uncertainties). Right: same measurements, but corrected for the gradual motion, and shifted, so the first Keck point is in (0, 0). Labels φS0 show phases of the 94.2-day orbit, according to the ephemeris used to clean the S0 curve from eclipses (Sect. 2.2). The data are clearly inconsistent with a P = 94.2 d, â ≃ 1.55 mas, i ≃ 90° orbit.
Current usage metrics show cumulative count of Article Views (full-text article views including HTML views, PDF and ePub downloads, according to the available data) and Abstracts Views on Vision4Press platform.
Data correspond to usage on the plateform after 2015. The current usage metrics is available 48-96 hours after online publication and is updated daily on week days.
Initial download of the metrics may take a while.