Fig. 13
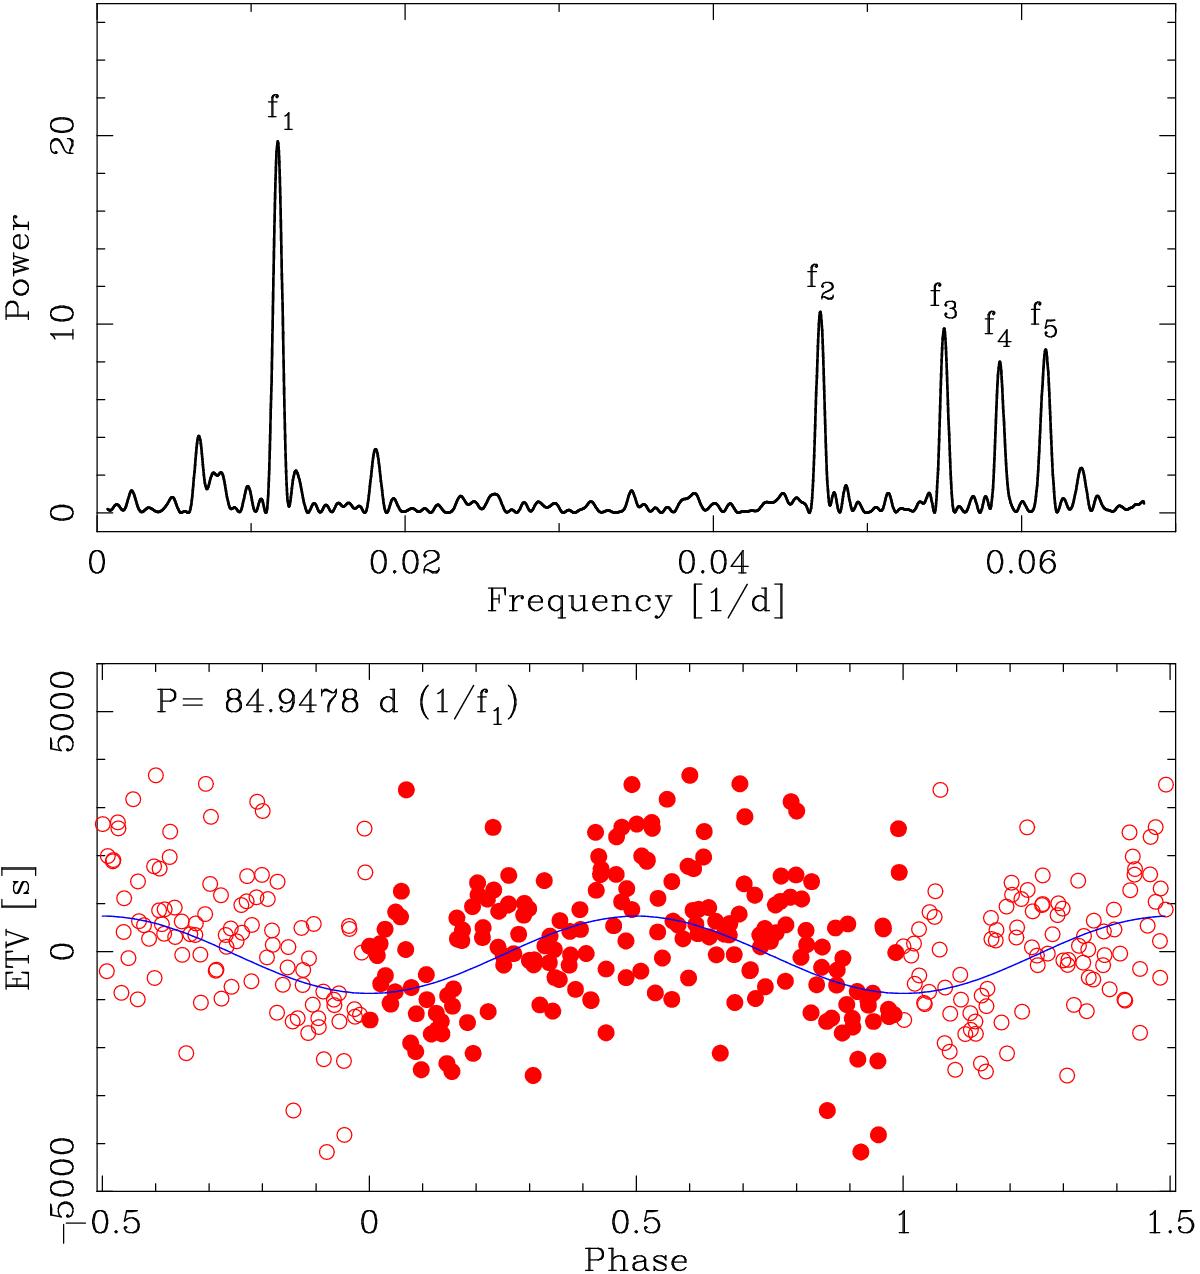
Top: an LS periodogram (in frequency domain) of the ETVs of the S3 curve. Five most prominent frequencies are marked. They were also detected by FREDEC. Bottom: the ETVs (red points) phase-folded with the period corresponding to the highest peak of the periodogram. The best-fitting sine function is plotted over (blue line). The data are repeated at phases <0.0 and >1.0 for clarity.
Current usage metrics show cumulative count of Article Views (full-text article views including HTML views, PDF and ePub downloads, according to the available data) and Abstracts Views on Vision4Press platform.
Data correspond to usage on the plateform after 2015. The current usage metrics is available 48-96 hours after online publication and is updated daily on week days.
Initial download of the metrics may take a while.