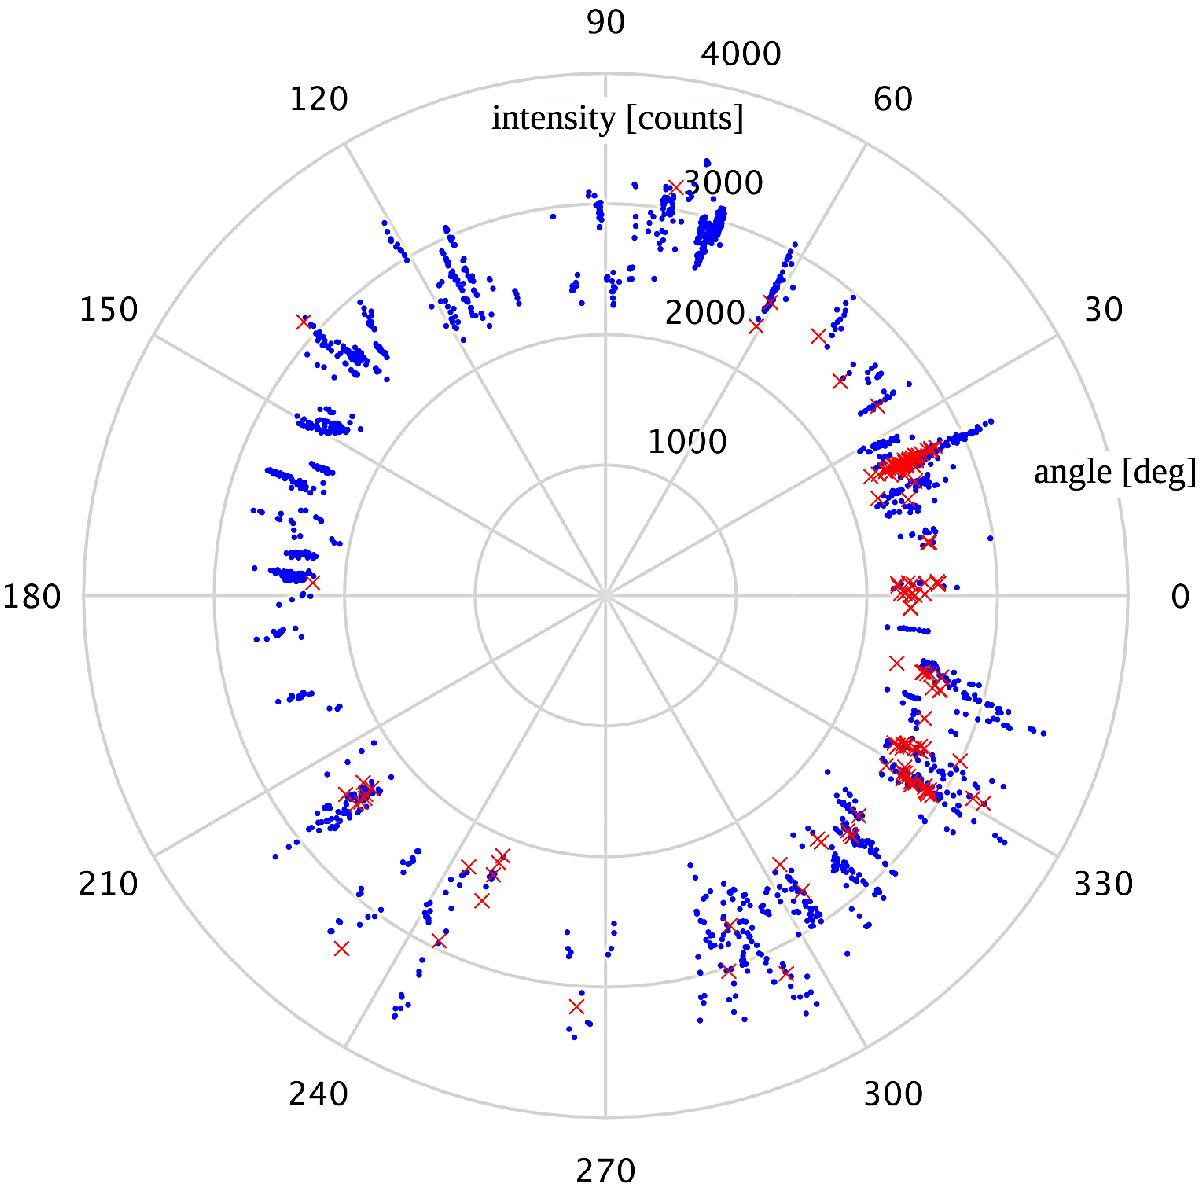
Fig. 9

Angular position inside the penumbra centred on the umbra, degrees along the polar axis vs. peak intensity in counts of blue and red peaks in PMJ profiles in the Ca ii 8542 Å line. Plotted are the peak-intensities in the respective wing for PMJs with automatically identifiable peaks in the red (crosses, N = 143) and blue (dots, N = 1725) wings of the line. The direction to disk centre is at approximately 270º.
Current usage metrics show cumulative count of Article Views (full-text article views including HTML views, PDF and ePub downloads, according to the available data) and Abstracts Views on Vision4Press platform.
Data correspond to usage on the plateform after 2015. The current usage metrics is available 48-96 hours after online publication and is updated daily on week days.
Initial download of the metrics may take a while.


