Fig. 7
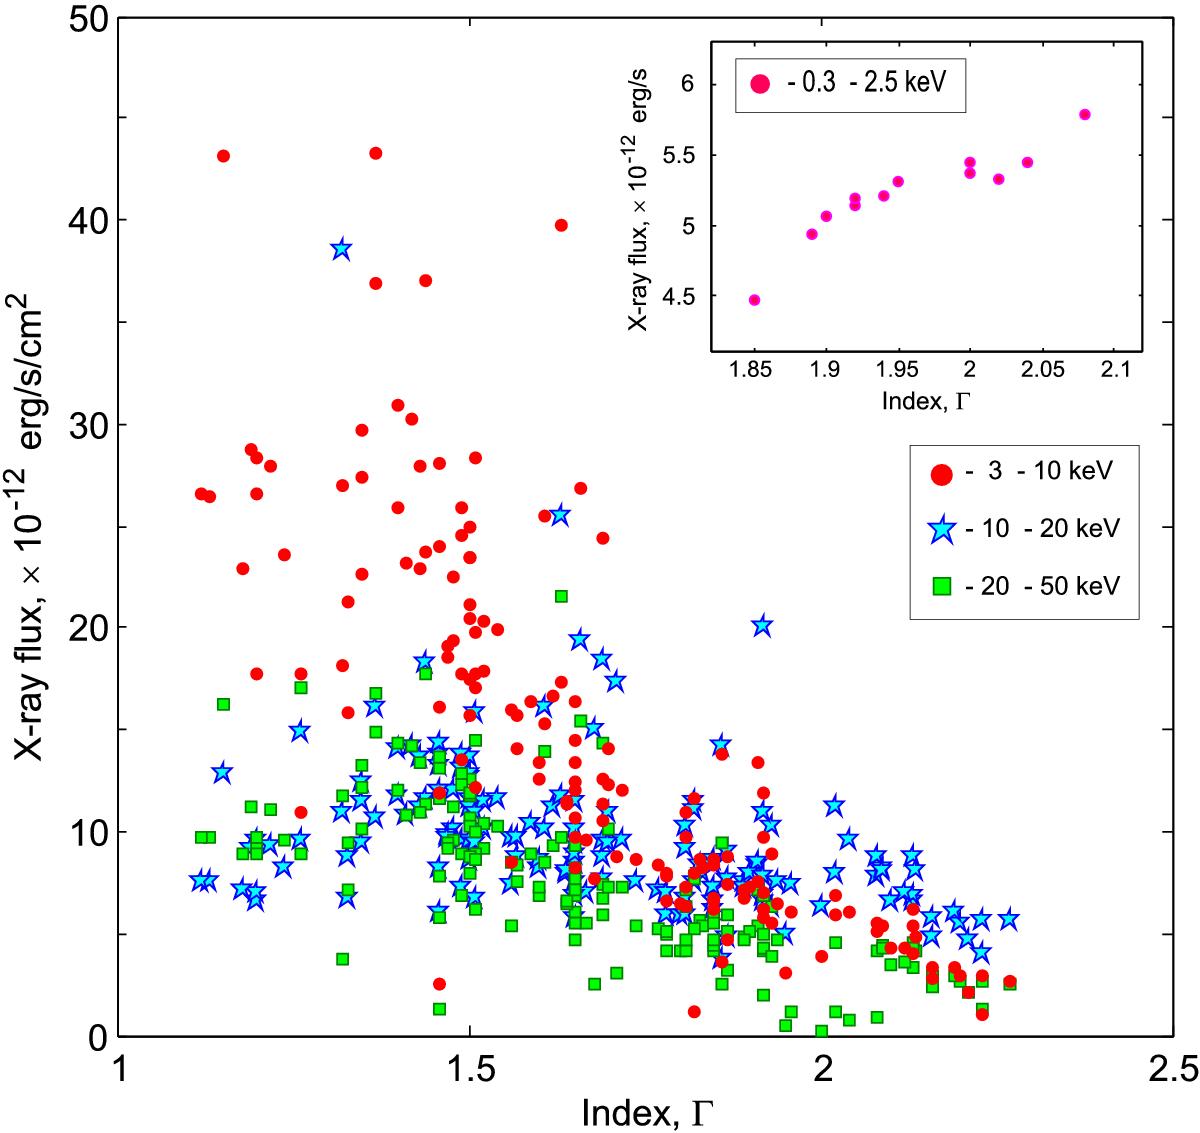
Hard X-ray flux (E> 3 keV) versus the photon index for the 3–10 keV (red circle), 10–20 keV (blue stars) and 20–50 keV (green squares) using the RXTE observations of BL Lac (1997–2001). Soft X-ray flux (0.3–2.5 keV) versus the photon index is plotted in the incorporated panel (top right) using Suzaku and Swift observations (see also Tables 4, 5).
Current usage metrics show cumulative count of Article Views (full-text article views including HTML views, PDF and ePub downloads, according to the available data) and Abstracts Views on Vision4Press platform.
Data correspond to usage on the plateform after 2015. The current usage metrics is available 48-96 hours after online publication and is updated daily on week days.
Initial download of the metrics may take a while.