Fig. 6
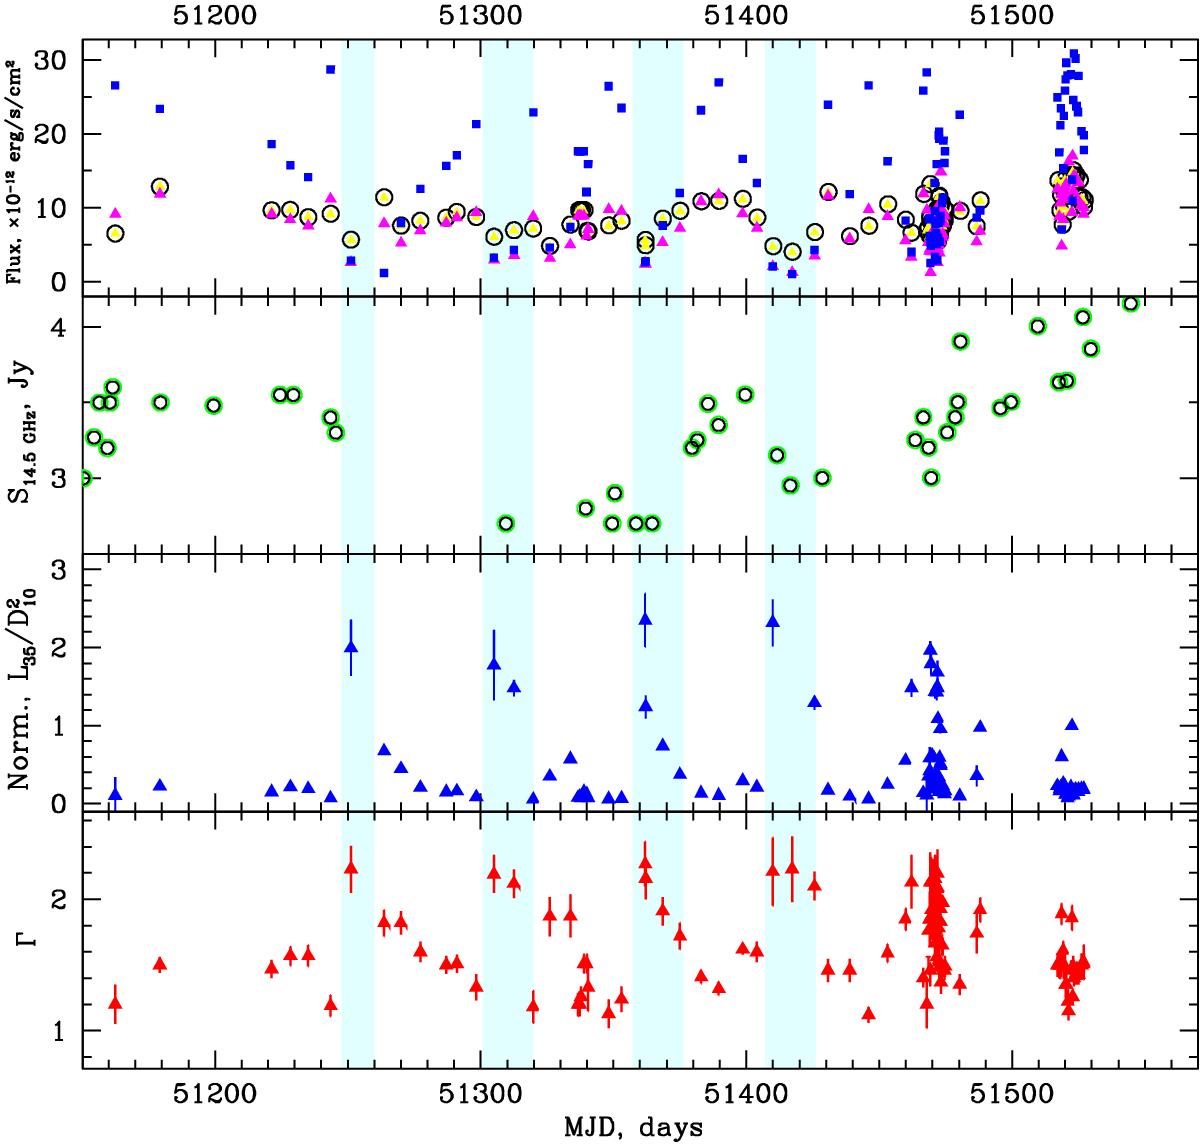
From top to bottom: evolutions of the model flux in the 3–10 keV, 10–20 keV, and 20–50 keV ranges (yellow, crimson, and blue points, respectively) using RXTE/PCA, the flux density S14.5 GHz at 14.5 GHz (UMRAO), the BMC normalization and Γ during the 1999 flare transition (R3, R5). Blue vertical strips indicate the phases, when X-ray flux (E> 3 keV) anticorrelates with Γ and the normalization NBMC.
Current usage metrics show cumulative count of Article Views (full-text article views including HTML views, PDF and ePub downloads, according to the available data) and Abstracts Views on Vision4Press platform.
Data correspond to usage on the plateform after 2015. The current usage metrics is available 48-96 hours after online publication and is updated daily on week days.
Initial download of the metrics may take a while.