Fig. 5
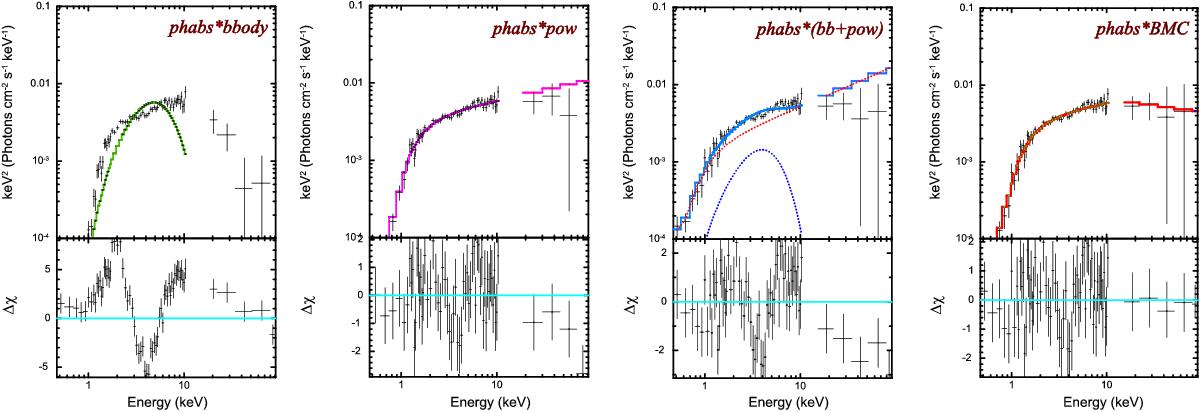
Best-fit spectra of BL Lac observed with BeppoSAX during the soft state in 1999 transition (dataset “S3”) in E ∗ F(E) units for the model fits (from left to right): phabs*bbody (green line, ![]() for 79 d.o.f.), phabs*powerlaw (purple line,
for 79 d.o.f.), phabs*powerlaw (purple line, ![]() for 79 d.o.f.), phabs*(bbody+powerlaw) (light-blue line,
for 79 d.o.f.), phabs*(bbody+powerlaw) (light-blue line, ![]() for 77 d.o.f.) and phabs*BMC (red line,
for 77 d.o.f.) and phabs*BMC (red line, ![]() for 77 d.o.f.). The data are shown by black crosses. For an additive model, phabs*(bbody+powerlaw), the model components are presented by dashed blue and red lines for blackbody and powerlaw, respectively (see details in Table 6).
for 77 d.o.f.). The data are shown by black crosses. For an additive model, phabs*(bbody+powerlaw), the model components are presented by dashed blue and red lines for blackbody and powerlaw, respectively (see details in Table 6).
Current usage metrics show cumulative count of Article Views (full-text article views including HTML views, PDF and ePub downloads, according to the available data) and Abstracts Views on Vision4Press platform.
Data correspond to usage on the plateform after 2015. The current usage metrics is available 48-96 hours after online publication and is updated daily on week days.
Initial download of the metrics may take a while.