Fig. 1
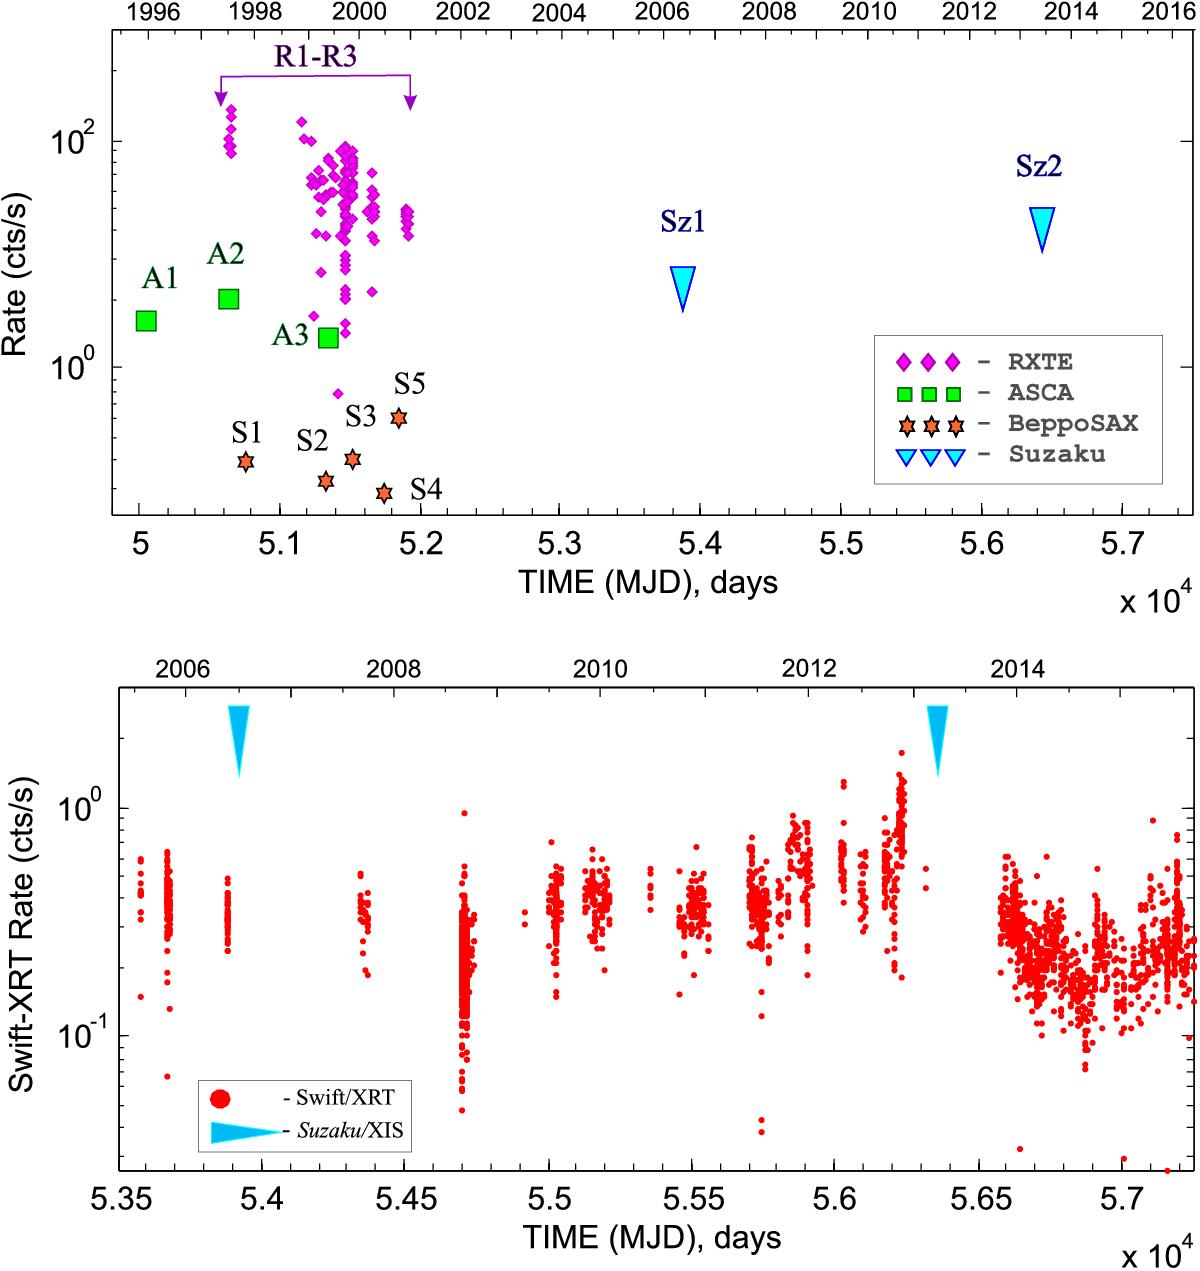
Top: time distribution of ASCA (green squares, “A”-marks), RXTE (pink diamonds, “R”-marks), BeppoSAX (brown stars, “S”-marks), and Suzaku (blue triangles, “Sz”-marks) observations (see Tables 1–4). Bottom: Swift/XRT light curve of BL Lac in the 0.3−10 keV range during 2005–2016. Red points mark the source signal (with 2-σ detection level) and blue arrows show the MJD of Suzaku. Note, that rate-axis is related to RTXE/PCA count rate which are not comparable with other instruments (ASCA, BeppoSAX and Suzaku). For clarity, the error bars are omitted.
Current usage metrics show cumulative count of Article Views (full-text article views including HTML views, PDF and ePub downloads, according to the available data) and Abstracts Views on Vision4Press platform.
Data correspond to usage on the plateform after 2015. The current usage metrics is available 48-96 hours after online publication and is updated daily on week days.
Initial download of the metrics may take a while.