Fig. 6
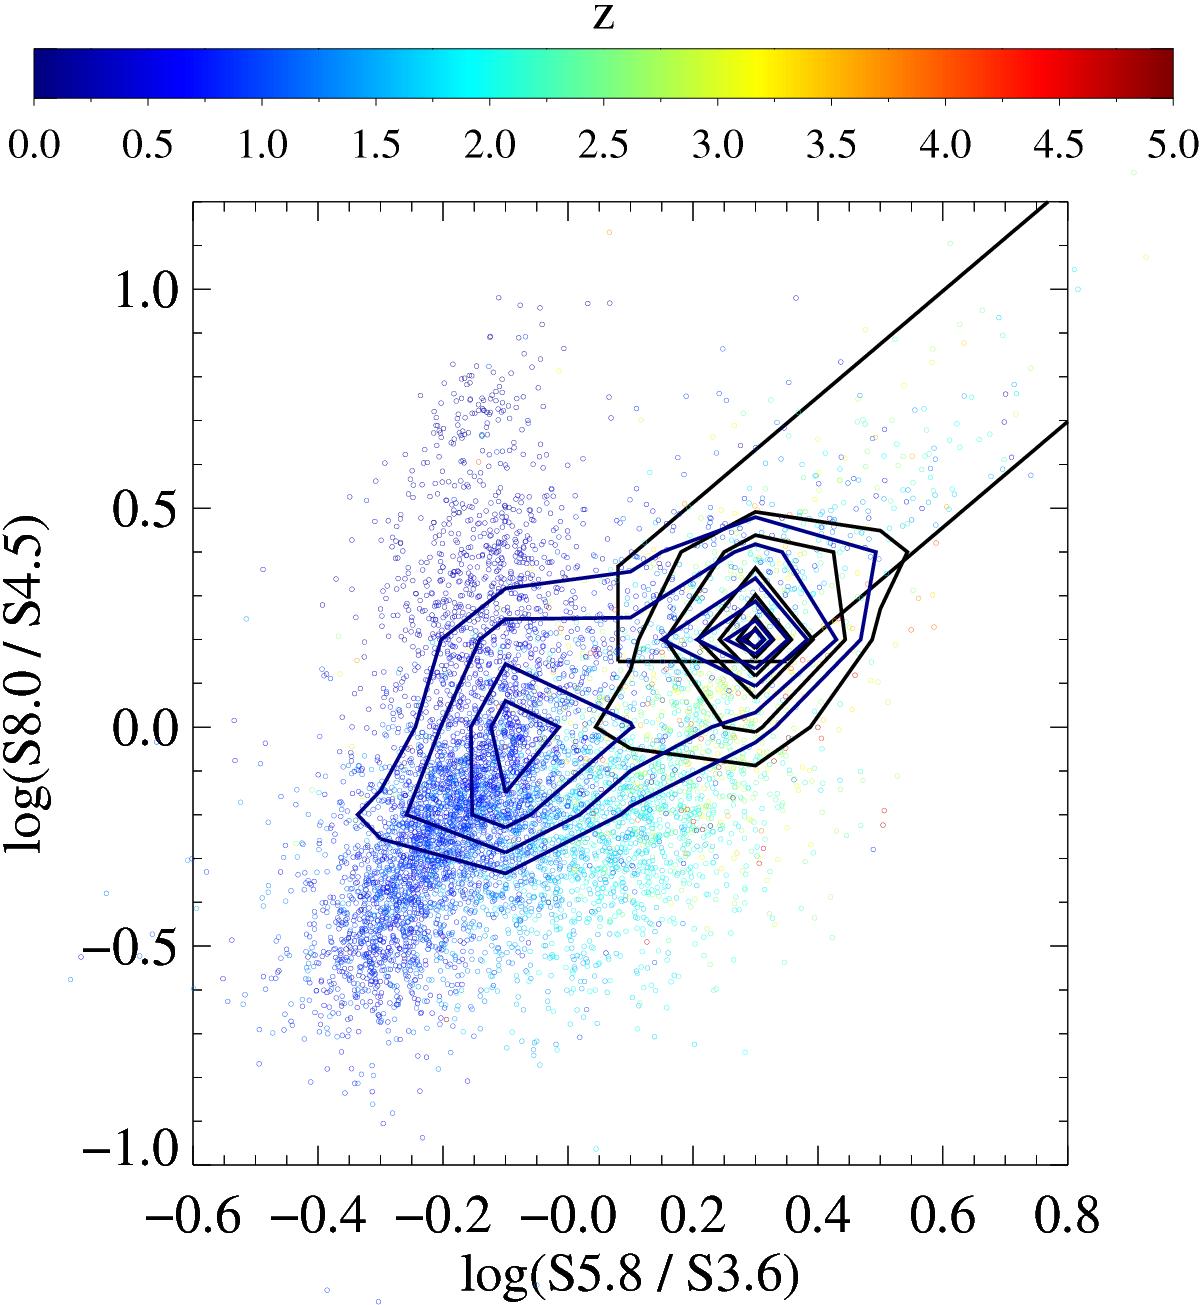
MIR color–color diagram for 6793 radio sources with available spectroscopic or photometric redshifts and IRAC magnitudes (symbols), color coded according to their redshift value, as indicated in the color bar at the top. The blue lines indicate the 2D density contours for the sample with IRAC counterparts (205 sources), while the black lines represent the 2D density contours for IRAC counterparts without a redshift measurement (122 objects). The black wedge indicates the Donley et al. (2012) area for the selection of MIR-AGN in this color–color plane.
Current usage metrics show cumulative count of Article Views (full-text article views including HTML views, PDF and ePub downloads, according to the available data) and Abstracts Views on Vision4Press platform.
Data correspond to usage on the plateform after 2015. The current usage metrics is available 48-96 hours after online publication and is updated daily on week days.
Initial download of the metrics may take a while.