Fig. 3
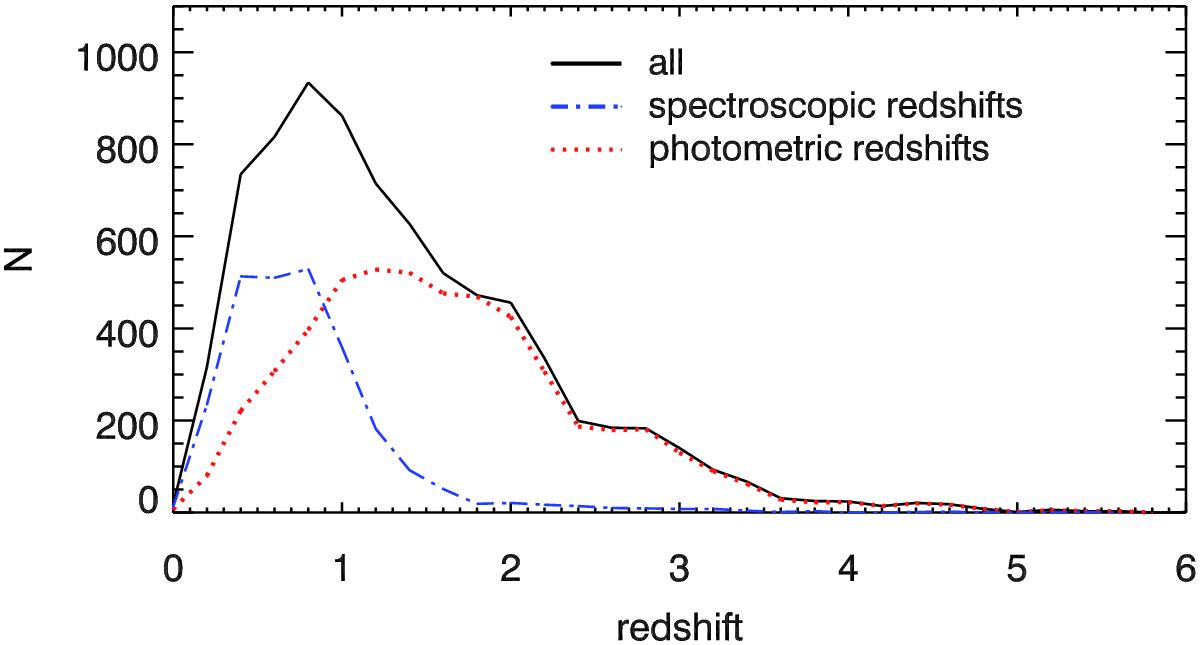
Redshift distribution of the matched (COSMOS2015 and i band) counterparts with redshifts. The black solid line shows the distribution of the best available spectroscopic or photometric redshifts, the red dotted line that of the photometric redshift subsample, while the blue dot-dashed line that of the spectroscopic redshift subsample.
Current usage metrics show cumulative count of Article Views (full-text article views including HTML views, PDF and ePub downloads, according to the available data) and Abstracts Views on Vision4Press platform.
Data correspond to usage on the plateform after 2015. The current usage metrics is available 48-96 hours after online publication and is updated daily on week days.
Initial download of the metrics may take a while.