Fig. B.1
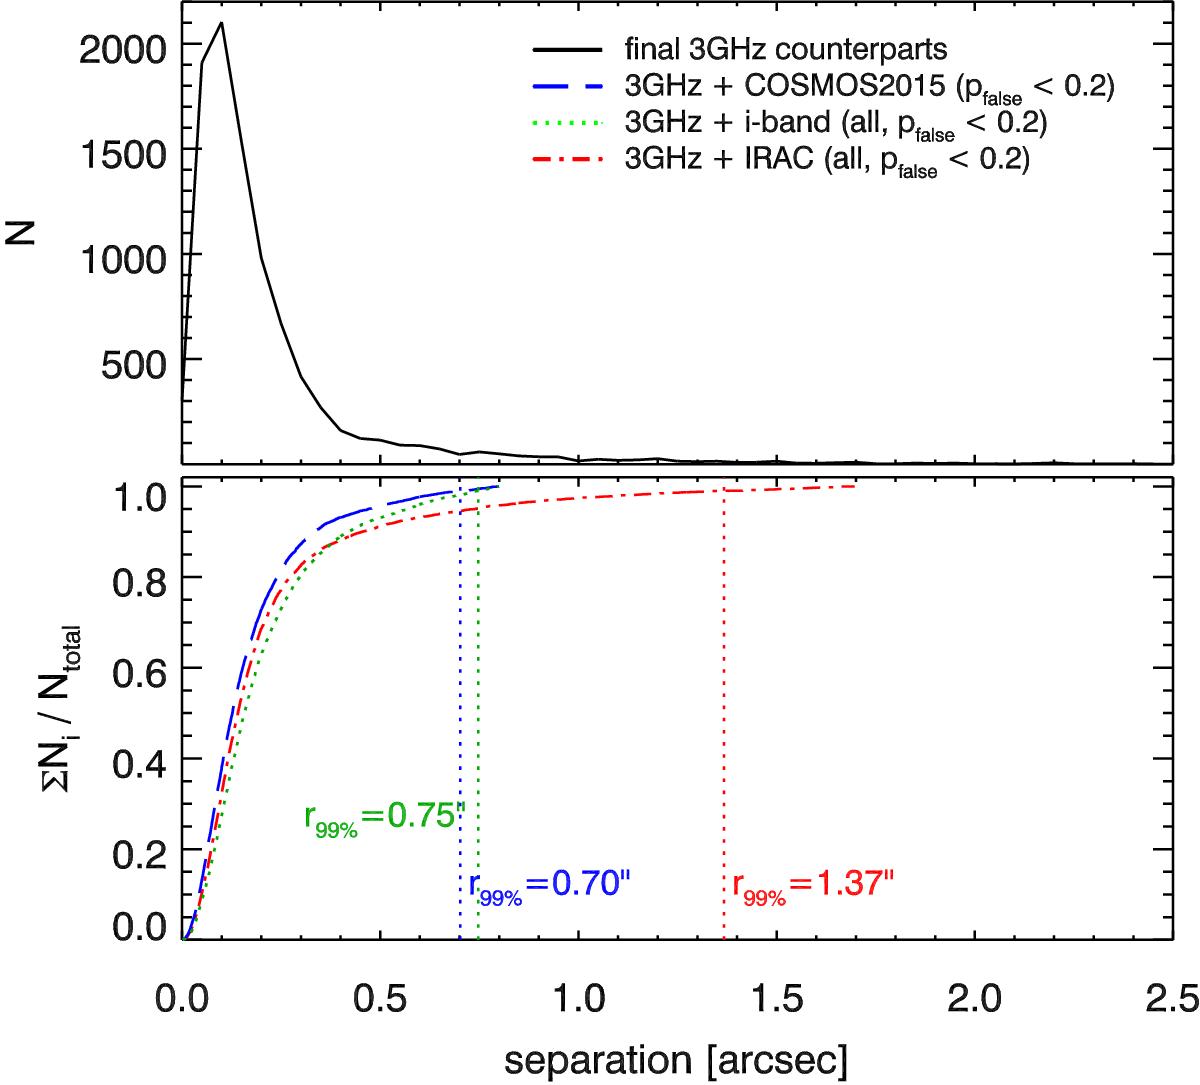
Differential (top panel) distribution of the separations of the final counterparts from the (single-component) radio sources, drawn from the COSMOS2015, i band, or IRAC catalogs (as described in the text). The bottom panel shows the cumulative distributions of the separations of all counterpart candidates (with pfalse ≤ 0.2) drawn from the COSMOS2015 (blue dashed curve), i band (green dotted curve), and IRAC (red dash-dotted curve) catalogs. Also indicated is the separation encompassing 99% of the counterparts for each of the counterpart sample.
Current usage metrics show cumulative count of Article Views (full-text article views including HTML views, PDF and ePub downloads, according to the available data) and Abstracts Views on Vision4Press platform.
Data correspond to usage on the plateform after 2015. The current usage metrics is available 48-96 hours after online publication and is updated daily on week days.
Initial download of the metrics may take a while.