Free Access
Fig. 2
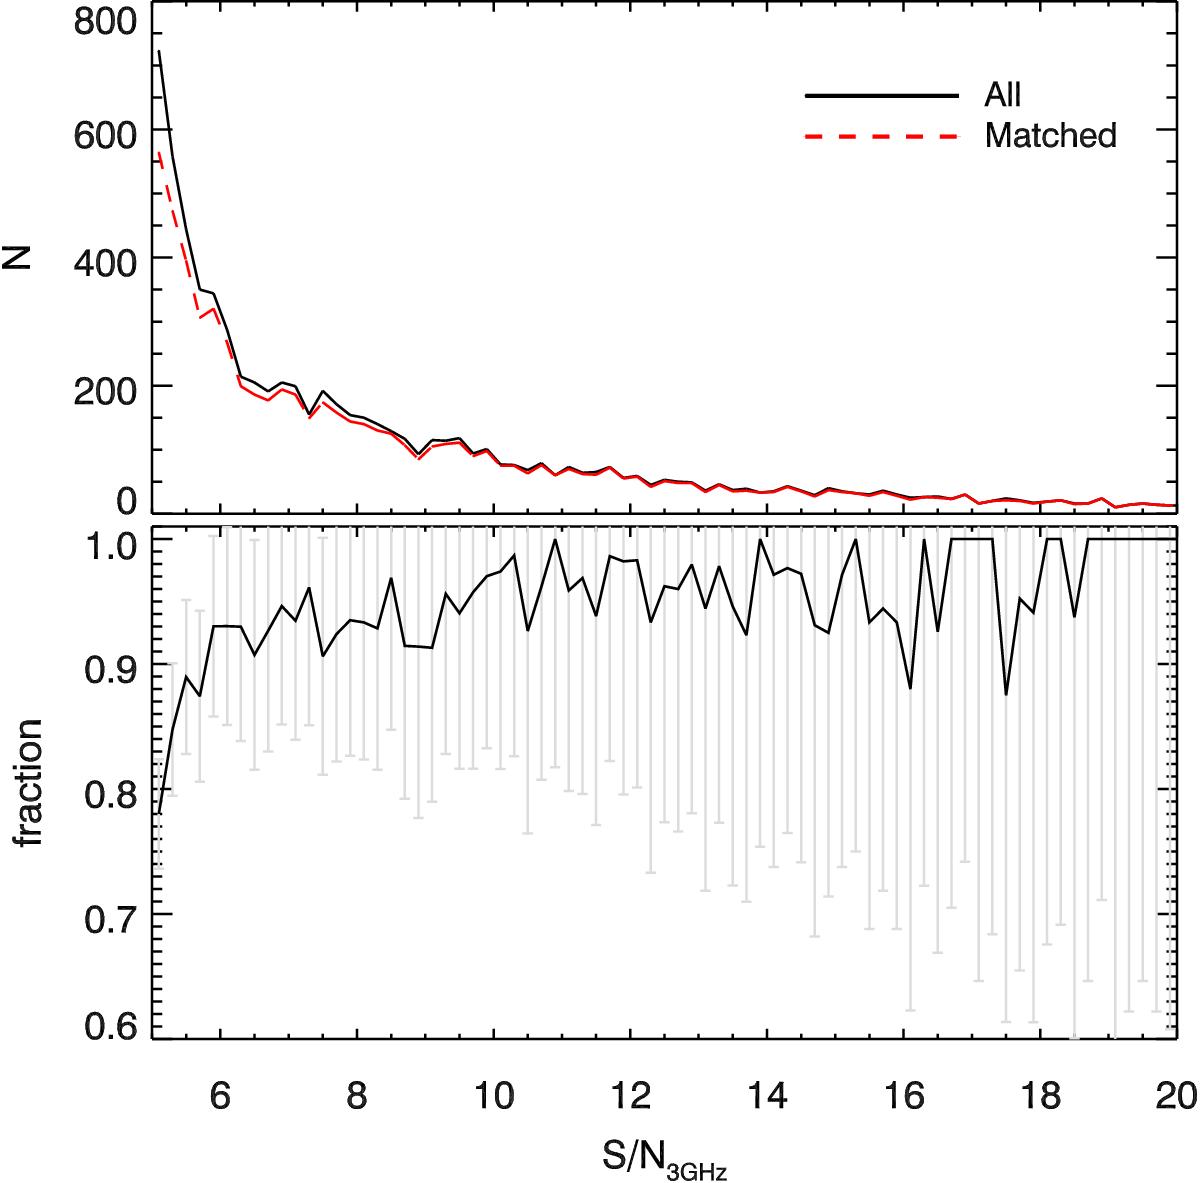
Top: signal-to-noise ratio distribution of all (black line) and matched (red dashed line) VLA 3 GHz single-component sources. Bottom: fraction of matched VLA 3 GHz single-component sources as a function of signal-to-noise ratio. Poisson errors are also shown.
Current usage metrics show cumulative count of Article Views (full-text article views including HTML views, PDF and ePub downloads, according to the available data) and Abstracts Views on Vision4Press platform.
Data correspond to usage on the plateform after 2015. The current usage metrics is available 48-96 hours after online publication and is updated daily on week days.
Initial download of the metrics may take a while.