Fig. A.4
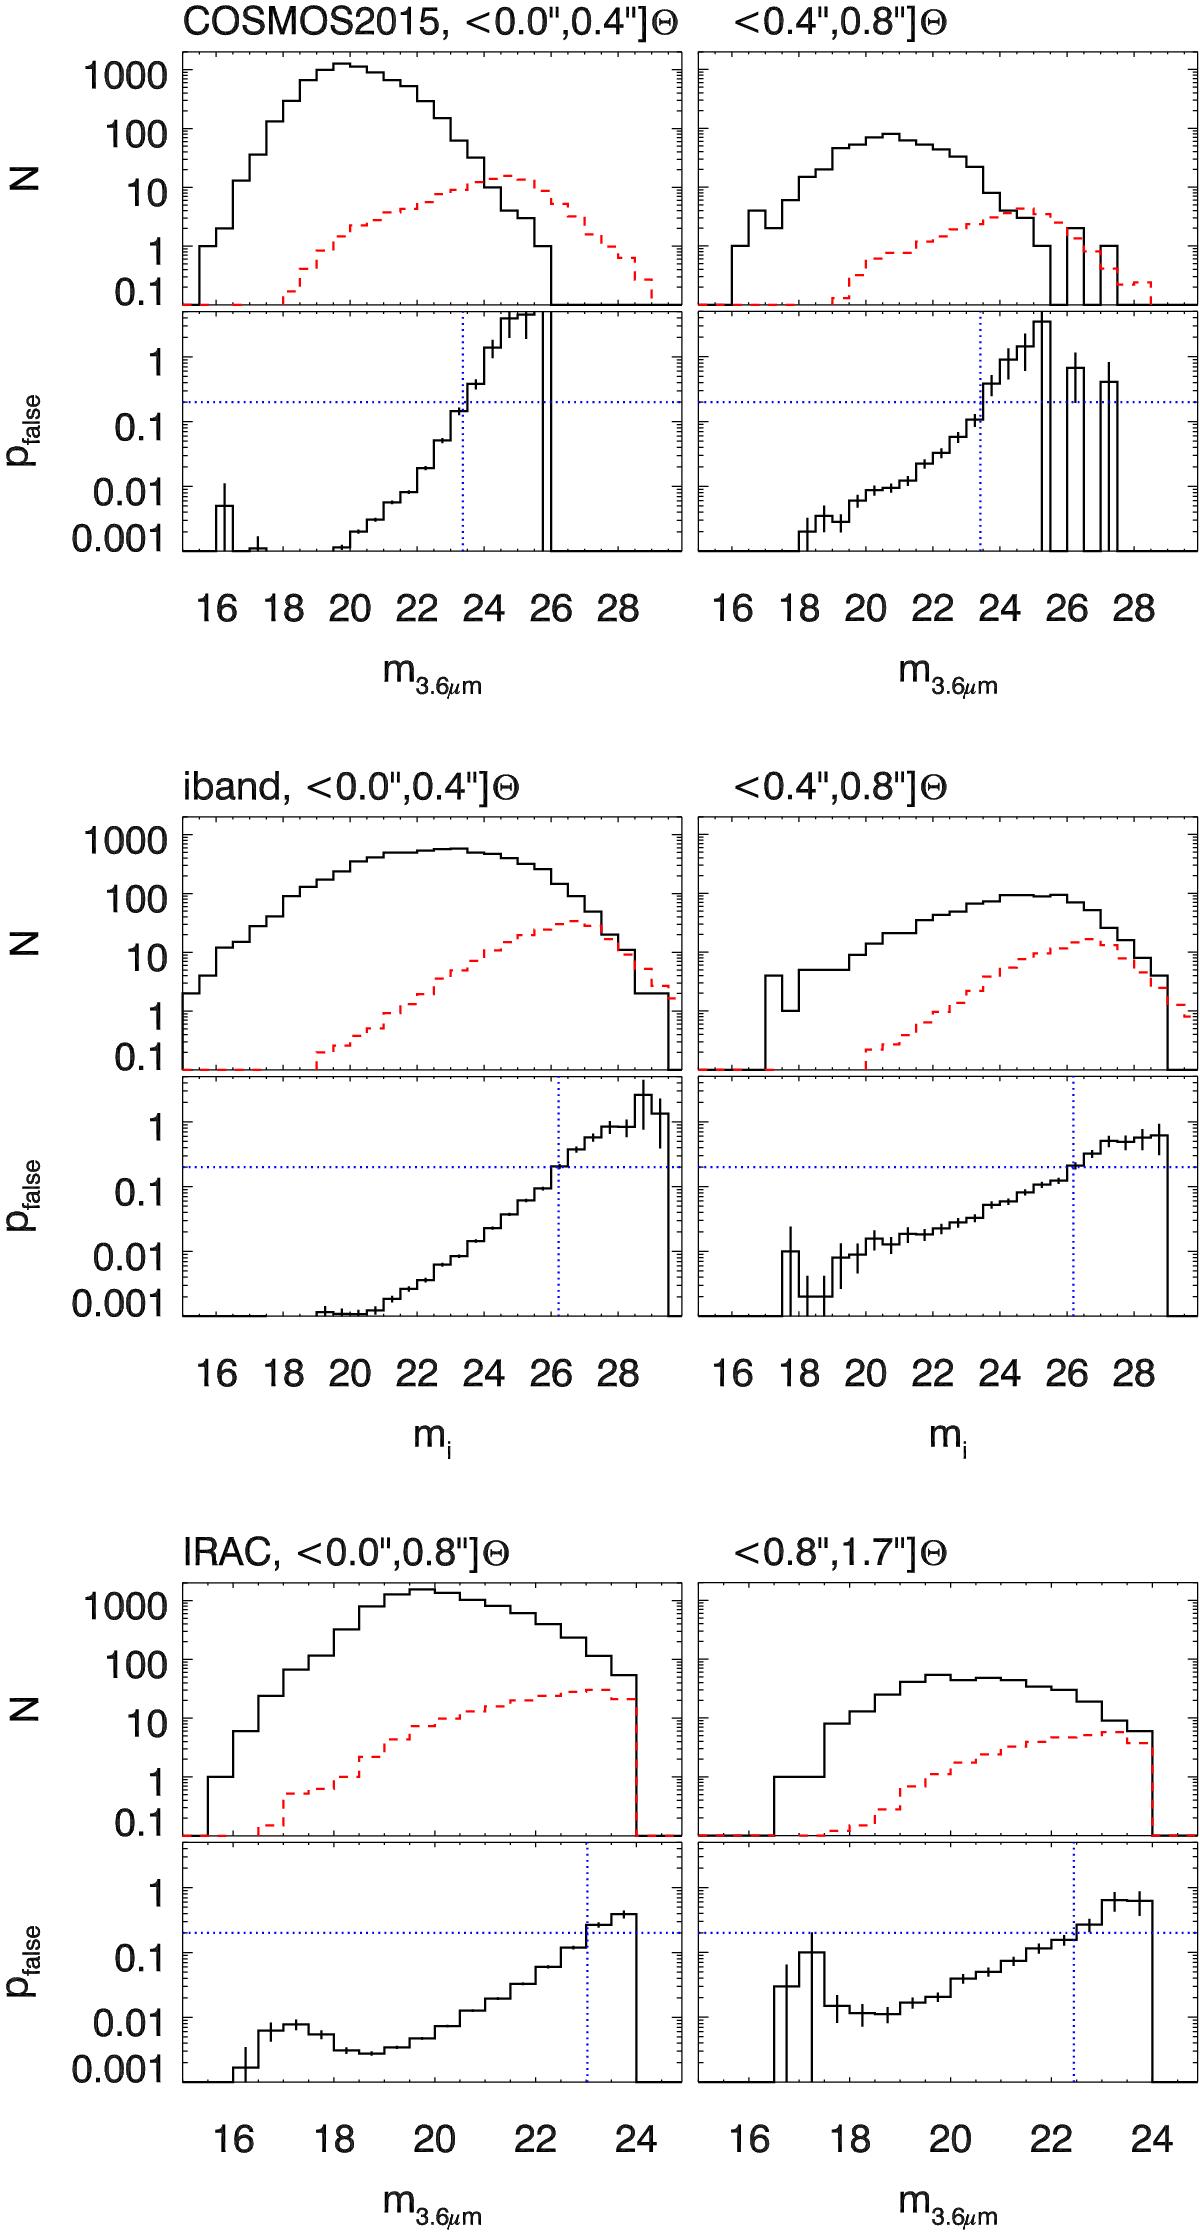
Top panels in each row: magnitude distribution of the real VLA-COSMOS 3 GHz counterparts (solid black line), and the simulated background (red dashed line) for the COSMOS2015 (top row), i band (middle row), and IRAC (bottom row) catalogs. The range of allowed separations between the radio sources and their counterparts is indicated above each panel (see text for details). Bottom panels in each row: ratio between the background and real magnitude distributions, defined as the false match probability (pfalse), as a function of magnitude. The dotted horizontal line shows the pfalse threshold of 0.2 beyond which counterparts are discarded, while the dotted vertical line shows the effective magnitude cut corresponding to pfalse = 0.2. Poisson errors are also indicated.
Current usage metrics show cumulative count of Article Views (full-text article views including HTML views, PDF and ePub downloads, according to the available data) and Abstracts Views on Vision4Press platform.
Data correspond to usage on the plateform after 2015. The current usage metrics is available 48-96 hours after online publication and is updated daily on week days.
Initial download of the metrics may take a while.