Fig. A.3
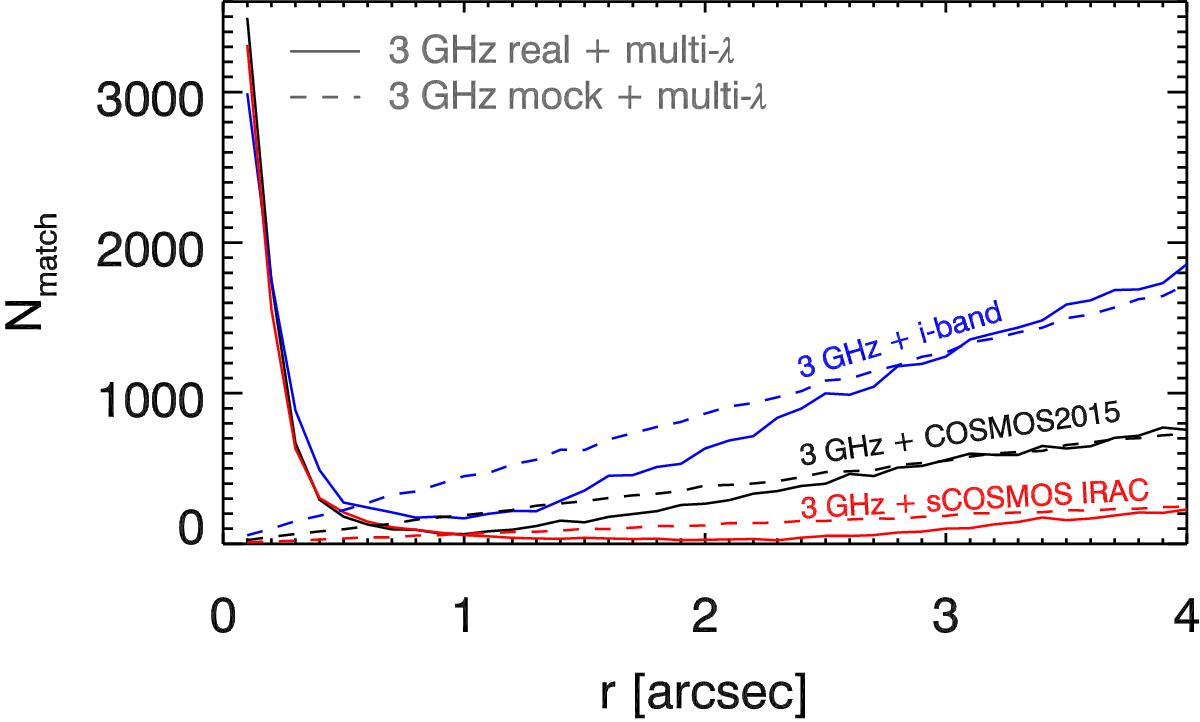
Number of all matches within 0.1″ wide annuli between the VLA-COSMOS 3 GHz Large Project sources and the COSMOS2015 (black), the i band selected (blue), and the IRAC 3.6 μm selected catalogs (red) (solid lines). Dashed lines represent the average number of matches in the three above-mentioned catalogs around randomized positions. The average was calculated using 10 different randomizations.
Current usage metrics show cumulative count of Article Views (full-text article views including HTML views, PDF and ePub downloads, according to the available data) and Abstracts Views on Vision4Press platform.
Data correspond to usage on the plateform after 2015. The current usage metrics is available 48-96 hours after online publication and is updated daily on week days.
Initial download of the metrics may take a while.