Fig. 14
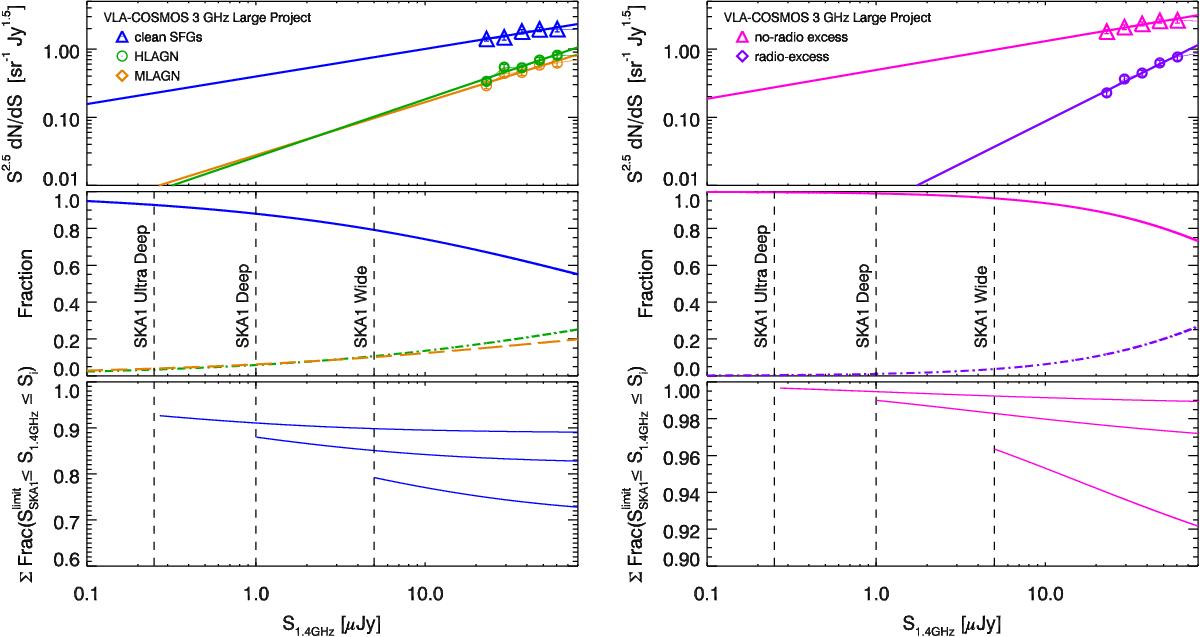
Top panels: VLA-COSMOS 3 GHz Large Project radio source counts at S1.4 GHz< 80 μJy for various, nonoverlapping galaxy populations (symbols, as indicated in the top panels). Simple linear extrapolations (fit to the S1.4 GHz< 80 μJy data) are shown as lines. Middle panels: fractional contribution of the various populations as a function of 1.4 GHz flux, extrapolated down to the 5σ detection limits of the SKA1 Ultra Deep, Deep, and Wide radio continuum surveys (vertical dashed lines; cf. Table 1 in Prandoni & Seymour 2015). Bottom panels: cumulative fractions of clean SFGs (left), and no radio excess sources (right) as a function of 1.4 GHz flux for each of the three SKA1 flux limits (shown as the three curves in each panel). For each given flux the y-axis value corresponds to the total fraction of the population within the flux range limited at the low end by the 5σ limit of the corresponding SKA1 survey and at the high end by the flux value given on the x-axis.
Current usage metrics show cumulative count of Article Views (full-text article views including HTML views, PDF and ePub downloads, according to the available data) and Abstracts Views on Vision4Press platform.
Data correspond to usage on the plateform after 2015. The current usage metrics is available 48-96 hours after online publication and is updated daily on week days.
Initial download of the metrics may take a while.