Fig. 9
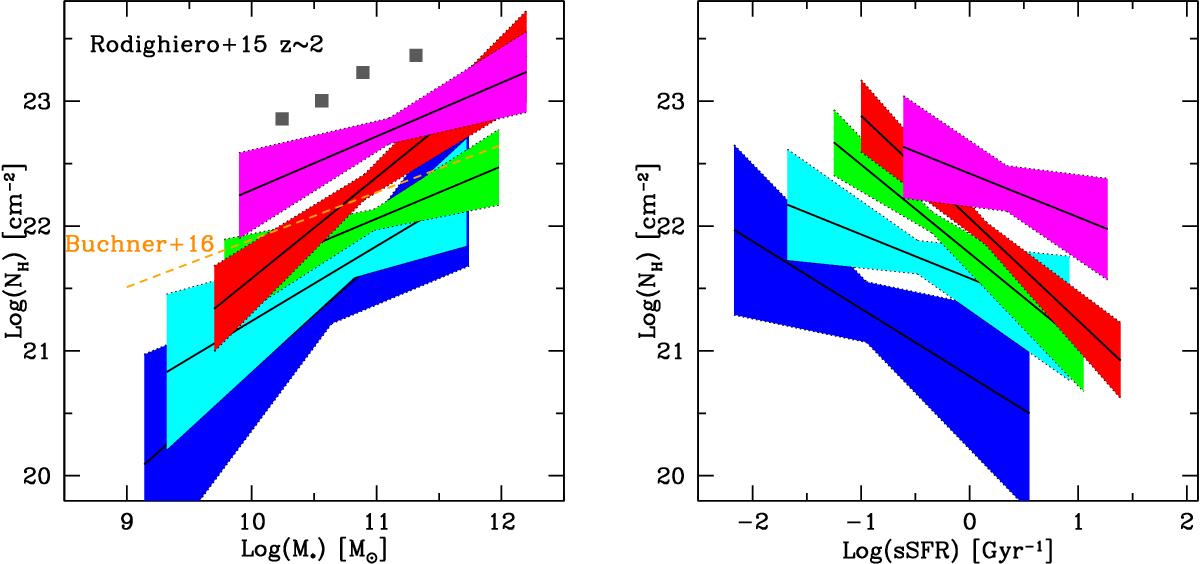
Linear regression of NH vs. M∗ (left) and sSFR (right) in five redshift bins. The regression is performed using the linmix code, which also takes into account the NH upper limits. The color-coding is the same as in Fig. 4. The gray squares in the left panel show results from Rodighiero et al. (2015) at z ~ 2, obtained from the HR of X-ray stacked images of FIR detected galaxies in the COSMOS field. The orange dashed line is the relation found in Buchner et al. (2017) for a sample of GRB hosts in a wide range of redshifts (see text).
Current usage metrics show cumulative count of Article Views (full-text article views including HTML views, PDF and ePub downloads, according to the available data) and Abstracts Views on Vision4Press platform.
Data correspond to usage on the plateform after 2015. The current usage metrics is available 48-96 hours after online publication and is updated daily on week days.
Initial download of the metrics may take a while.