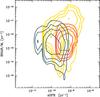
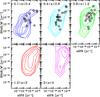
Fig. 8
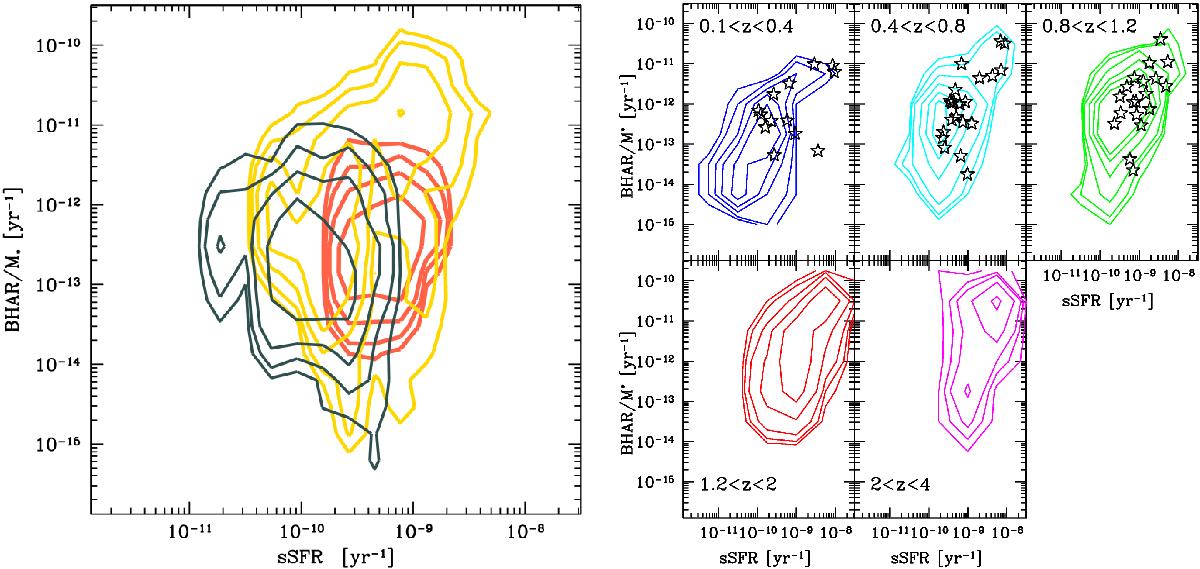
Left: BHAR/M∗ rate vs. sSFR contours obtained from the simulations presented in Volonteri et al. (2015a). In red the stochastic phase, in yellow the merger phase, and in black the remnant phase. Right: BHAR/M∗ vs. sSFR contours observed in COSMOS in five redshift bins. Sources that are in a major merger state in the first three redshift bins are marked with black stars.
Current usage metrics show cumulative count of Article Views (full-text article views including HTML views, PDF and ePub downloads, according to the available data) and Abstracts Views on Vision4Press platform.
Data correspond to usage on the plateform after 2015. The current usage metrics is available 48-96 hours after online publication and is updated daily on week days.
Initial download of the metrics may take a while.