Fig. 2
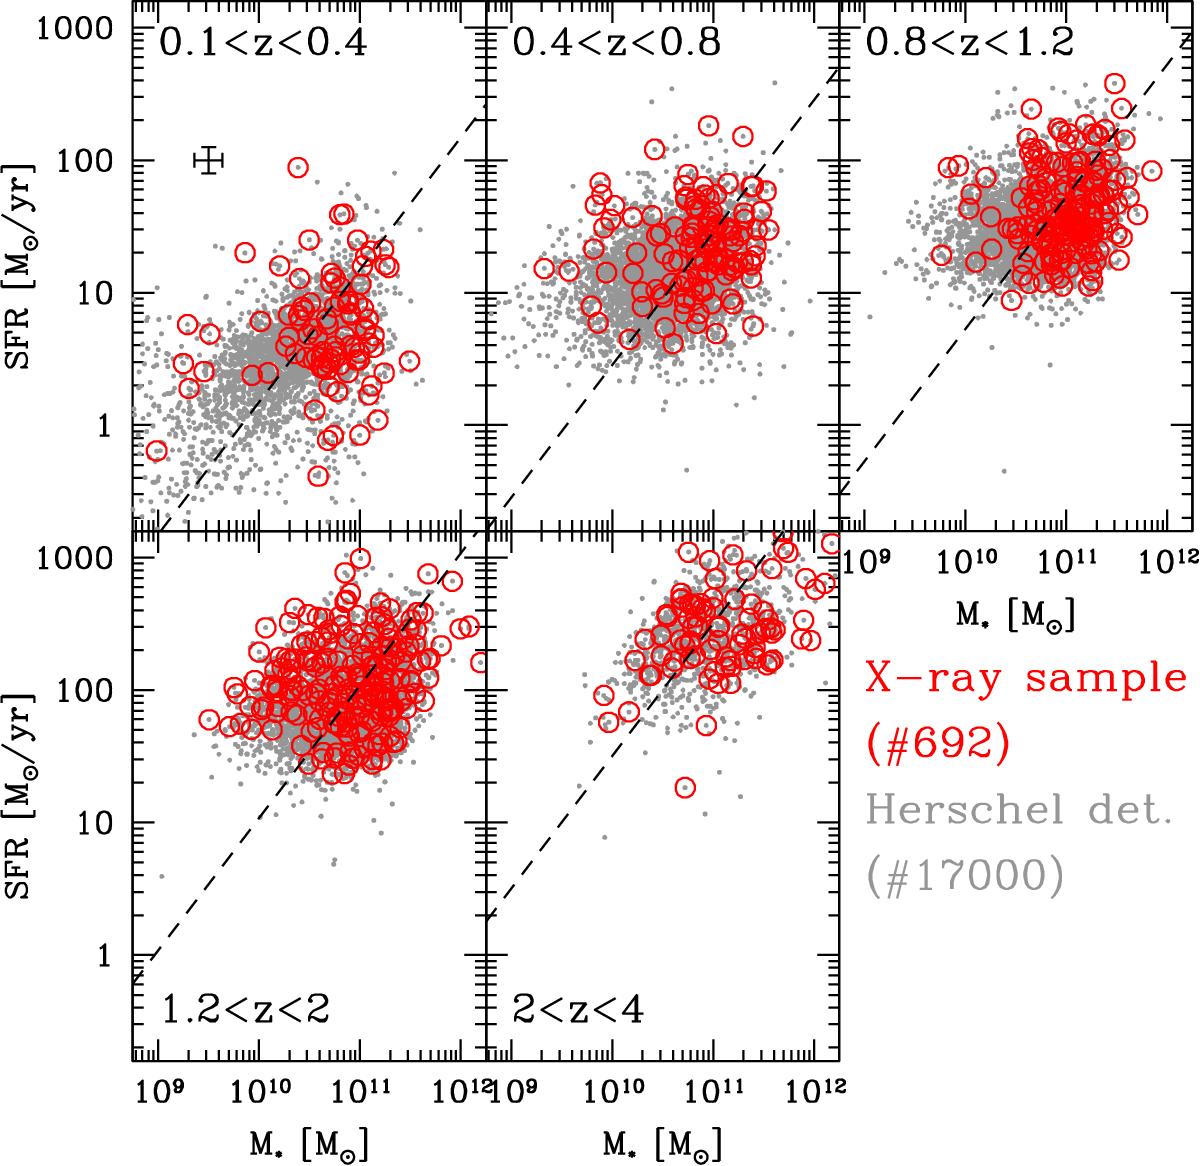
SFR vs. M∗ distribution for the entire sample of Herschel detected sources (~17 000 sources, gray points) and for the 692 sources with X-ray spectral analysis (X-FIR sample, red circles), divided into the five redshift bins defined in Sect. 2.1. The dashed lines in each panel mark the redshift-dependent MS of Withaker et al. (2012). The average 1σ error bars are shown in the top left as a black cross.
Current usage metrics show cumulative count of Article Views (full-text article views including HTML views, PDF and ePub downloads, according to the available data) and Abstracts Views on Vision4Press platform.
Data correspond to usage on the plateform after 2015. The current usage metrics is available 48-96 hours after online publication and is updated daily on week days.
Initial download of the metrics may take a while.