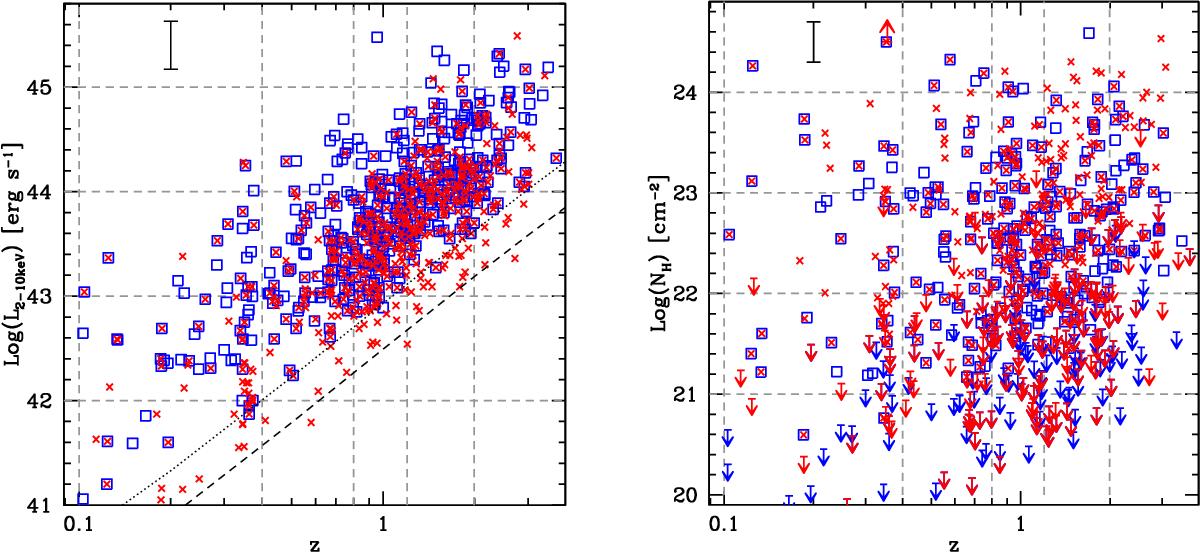
Fig. 1

Left: distribution of rest frame, absorption-corrected 2–10 keV luminosity vs. redshift for the XMM–Newton (blue squares) and Chandra (red crosses) detected sources that are also Herschel detected (X-FIR sample). The dotted (dashed) line marks the sensitivity limit of the XMM–Newton (Chandra) surveys. The redshift bins adopted in the text are marked by vertical gray dashed lines. Right: distribution of intrinsic column density vs. redshift for the sample. Symbols as in left panel. Arrows show upper limits for unobscured sources. The average 1σ error bars on LX and NH are shown at the top left of both panels.
Current usage metrics show cumulative count of Article Views (full-text article views including HTML views, PDF and ePub downloads, according to the available data) and Abstracts Views on Vision4Press platform.
Data correspond to usage on the plateform after 2015. The current usage metrics is available 48-96 hours after online publication and is updated daily on week days.
Initial download of the metrics may take a while.


