Fig. 9
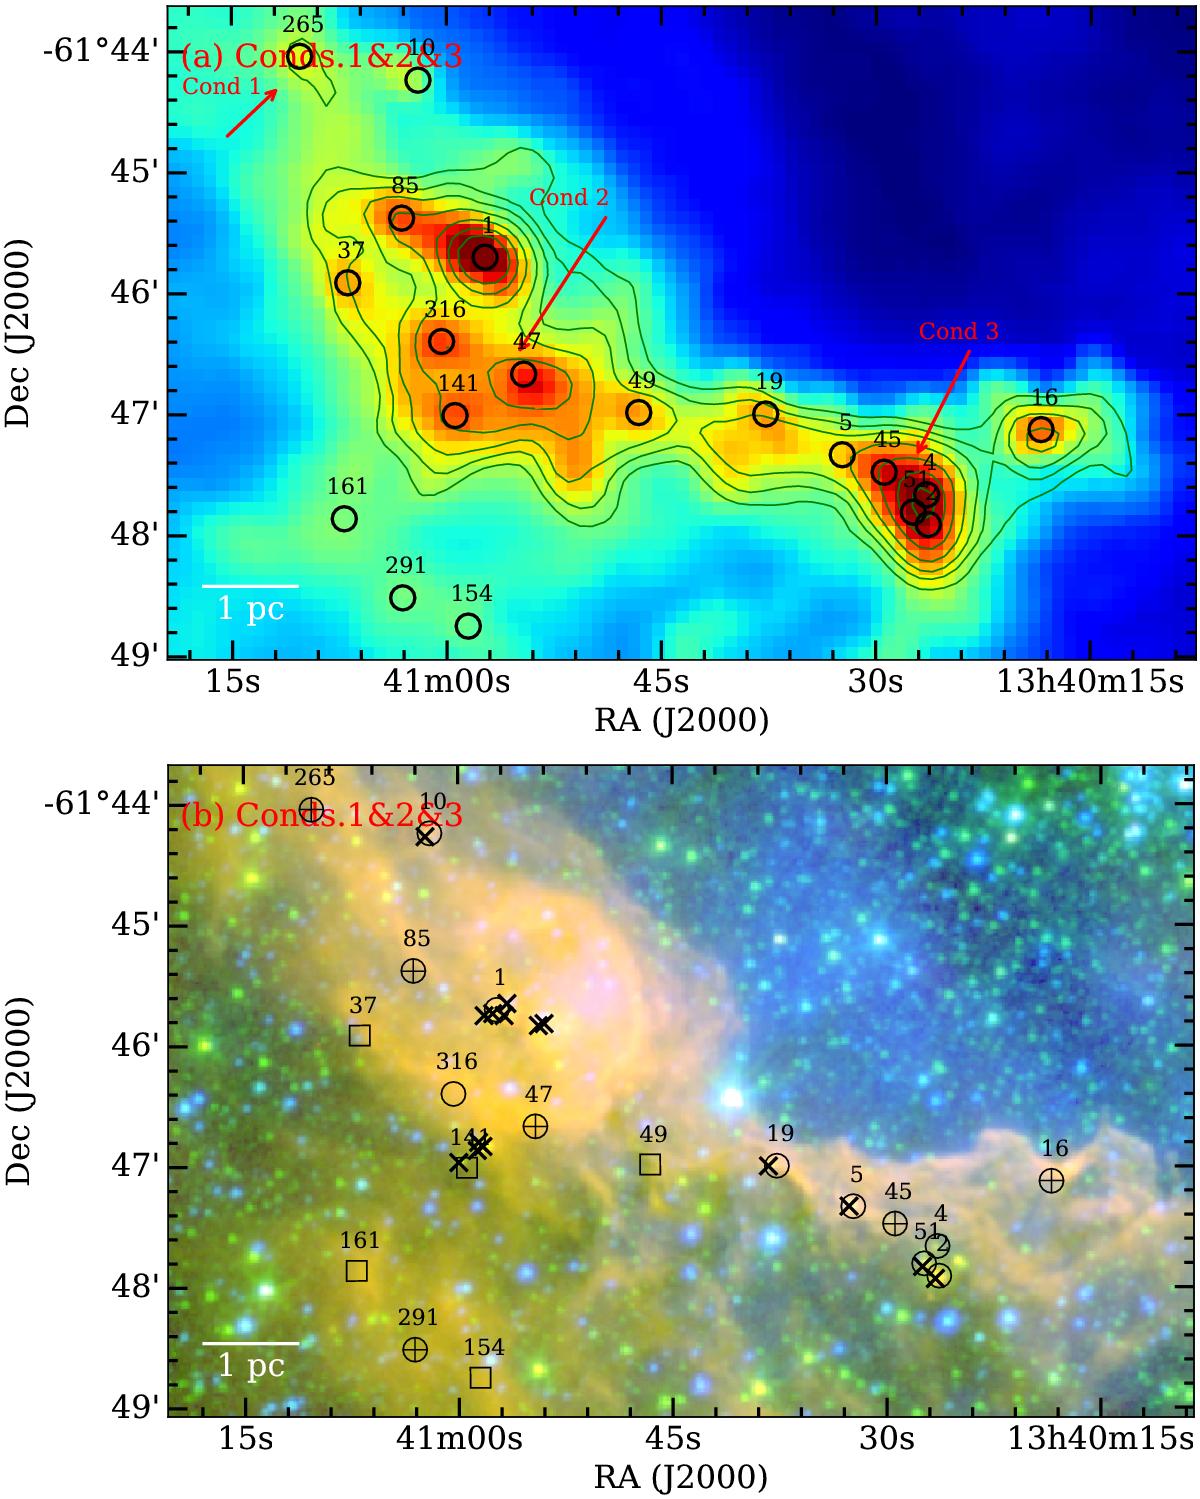
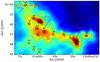
a) Compact sources (circles) overlaid on high-resolution (![]() ) column density map. Contours represent 870 μm continuum emission, showing levels of [0.55, 0.65, 0.75, 0.9, 1.1, 1.3, 1.5] Jy beam-1 (σ = 0.05−0.06 Jy beam-1). b) Compact sources overlaid on a three-color image. The Hα, 3.6 μm, and 8.0 μm emission are coded in blue, green, and red, respectively. The compact sources are symbolized in plus circles for class 0, in squares for IM, and in circles for class I objects. Crosses denote the class I YSOs identified by ZA06.
) column density map. Contours represent 870 μm continuum emission, showing levels of [0.55, 0.65, 0.75, 0.9, 1.1, 1.3, 1.5] Jy beam-1 (σ = 0.05−0.06 Jy beam-1). b) Compact sources overlaid on a three-color image. The Hα, 3.6 μm, and 8.0 μm emission are coded in blue, green, and red, respectively. The compact sources are symbolized in plus circles for class 0, in squares for IM, and in circles for class I objects. Crosses denote the class I YSOs identified by ZA06.
Current usage metrics show cumulative count of Article Views (full-text article views including HTML views, PDF and ePub downloads, according to the available data) and Abstracts Views on Vision4Press platform.
Data correspond to usage on the plateform after 2015. The current usage metrics is available 48-96 hours after online publication and is updated daily on week days.
Initial download of the metrics may take a while.