Fig. 5
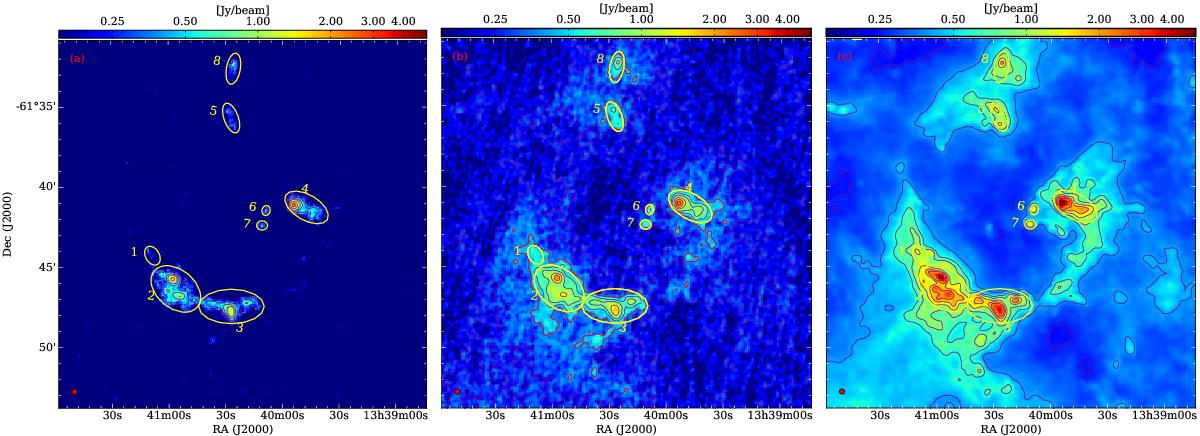
a) Observed APEX 870 μm map; b) APEX+Planck combined map; c) modeled 870 μm map by inverting from the high-resolution column density map. In all panels, the color bars are identical, going from 0.15 to 5.0 Jy beam-1 in logarithmic scale. The purple contours show levels of 0.25, 0.40, 0.60, 0.80, 1.20, 1.60, and 2.0 Jy beam-1. It is noteworthy that the sensitivity of the observed 870 μm map is 0.05−0.07 Jy beam-1. A beam size of ![]() is shown on the bottom left (full red circle). Eight condensations are roughly depicted in ellipses and labeled as given in ZA06.
is shown on the bottom left (full red circle). Eight condensations are roughly depicted in ellipses and labeled as given in ZA06.
Current usage metrics show cumulative count of Article Views (full-text article views including HTML views, PDF and ePub downloads, according to the available data) and Abstracts Views on Vision4Press platform.
Data correspond to usage on the plateform after 2015. The current usage metrics is available 48-96 hours after online publication and is updated daily on week days.
Initial download of the metrics may take a while.