Fig. 3
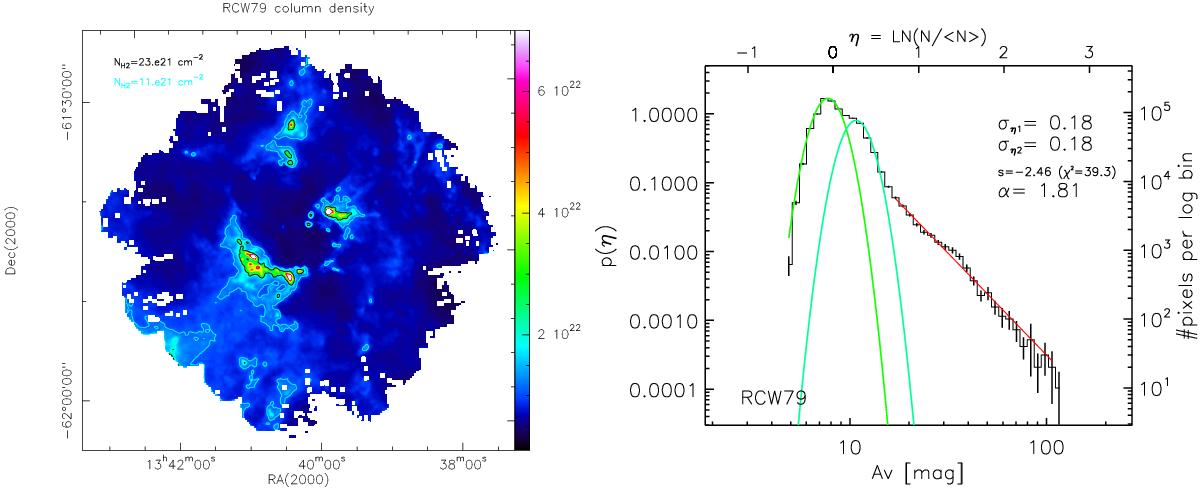
Left: high-angular (18.̋2) resolution column density of RCW 79. The contour levels characterize the gas in the compressed layer (above Av ~ 10–11) and the gravitationally dominated gas (above Av ~ 20). Right: PDF of the column density map. The distribution is characterized by two lognormals (dark and light green) with similar widths of σ = 0.18), and a power-law tail with a least-squares fit in red. The slope s of the power-law tail is –2.46.
Current usage metrics show cumulative count of Article Views (full-text article views including HTML views, PDF and ePub downloads, according to the available data) and Abstracts Views on Vision4Press platform.
Data correspond to usage on the plateform after 2015. The current usage metrics is available 48-96 hours after online publication and is updated daily on week days.
Initial download of the metrics may take a while.