Fig. 2
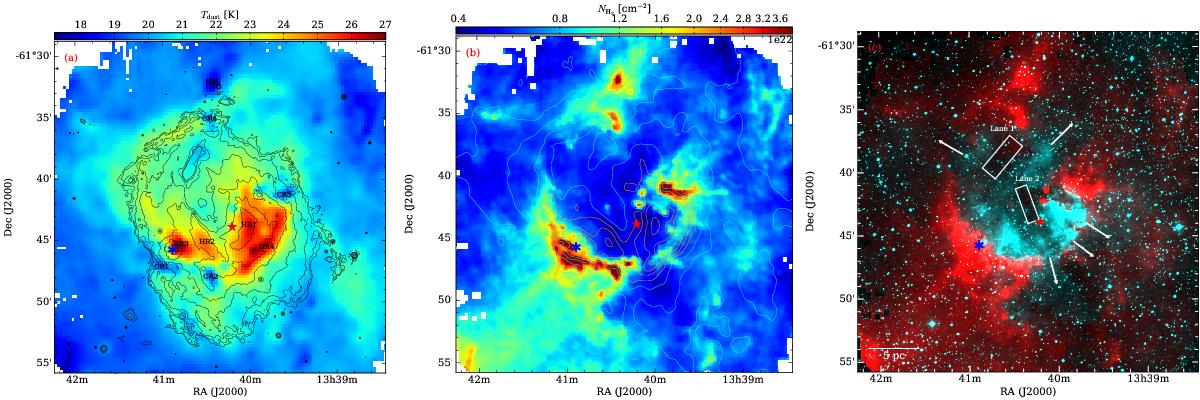
a) 36″ resolution dust temperature map (color scale) overlaid with Spitzer-MIPSGAL 24 μm emission (black contours). The contour levels are 40, 44, 55, 84, 163, 374, 940, and 2459 MJy sr-1. HRs 1-4 show the four hottest regions and CRs 1–5 the five coldest regions in RCW 79. b) ![]() resolution column density map with dust temperature contours. The cyan and orange temperature contours start from 20, and 23 K, respectively, with a step of 1 K. c) Two-color composite image consisting of the
resolution column density map with dust temperature contours. The cyan and orange temperature contours start from 20, and 23 K, respectively, with a step of 1 K. c) Two-color composite image consisting of the ![]() resolution column density map (in red) and the SuperCOSMOS Hα image (in turquoise). Arrows denote directions of leaking ionizing photons and rectangles outline dark Hα emission. A scale bar of 5 pc is shown on the bottom left. In all panels, the star and asterisk symbolize the center position of a cluster of exciting stars for the classical and compact H ii regions, respectively.
resolution column density map (in red) and the SuperCOSMOS Hα image (in turquoise). Arrows denote directions of leaking ionizing photons and rectangles outline dark Hα emission. A scale bar of 5 pc is shown on the bottom left. In all panels, the star and asterisk symbolize the center position of a cluster of exciting stars for the classical and compact H ii regions, respectively.
Current usage metrics show cumulative count of Article Views (full-text article views including HTML views, PDF and ePub downloads, according to the available data) and Abstracts Views on Vision4Press platform.
Data correspond to usage on the plateform after 2015. The current usage metrics is available 48-96 hours after online publication and is updated daily on week days.
Initial download of the metrics may take a while.