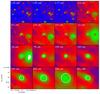
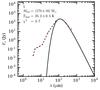
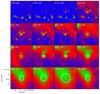
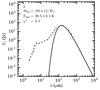
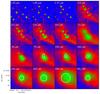
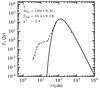
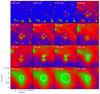
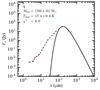
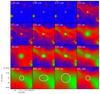
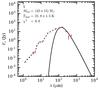
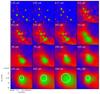
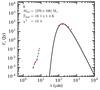
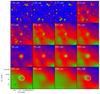
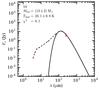
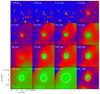
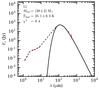
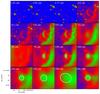
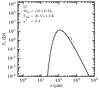
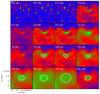
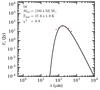
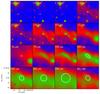
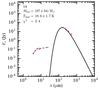
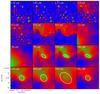
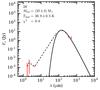
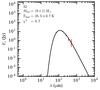
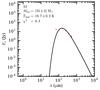
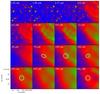
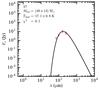
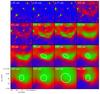
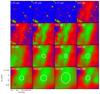
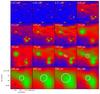
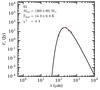
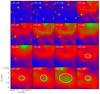
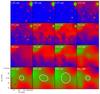
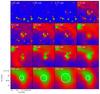
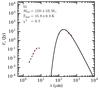
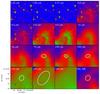
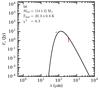
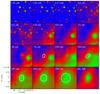
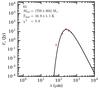
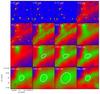
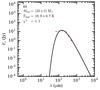
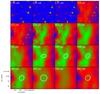
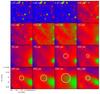
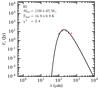
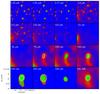
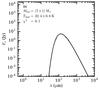
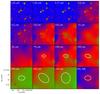
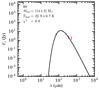
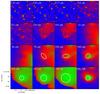
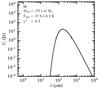
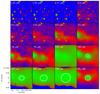
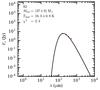
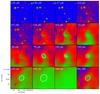
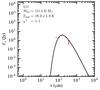
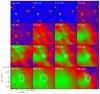
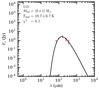
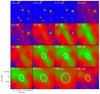
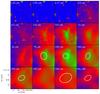
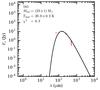
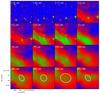
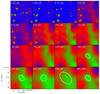
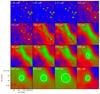
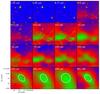
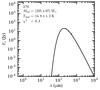
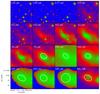
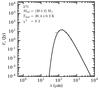
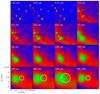
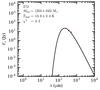
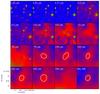
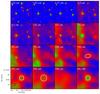
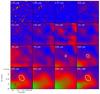
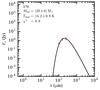
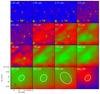
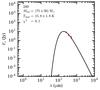
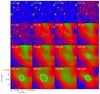
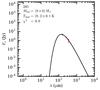
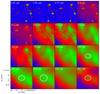
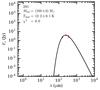
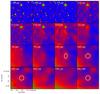
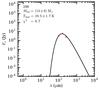
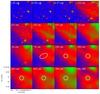
Fig. B.1
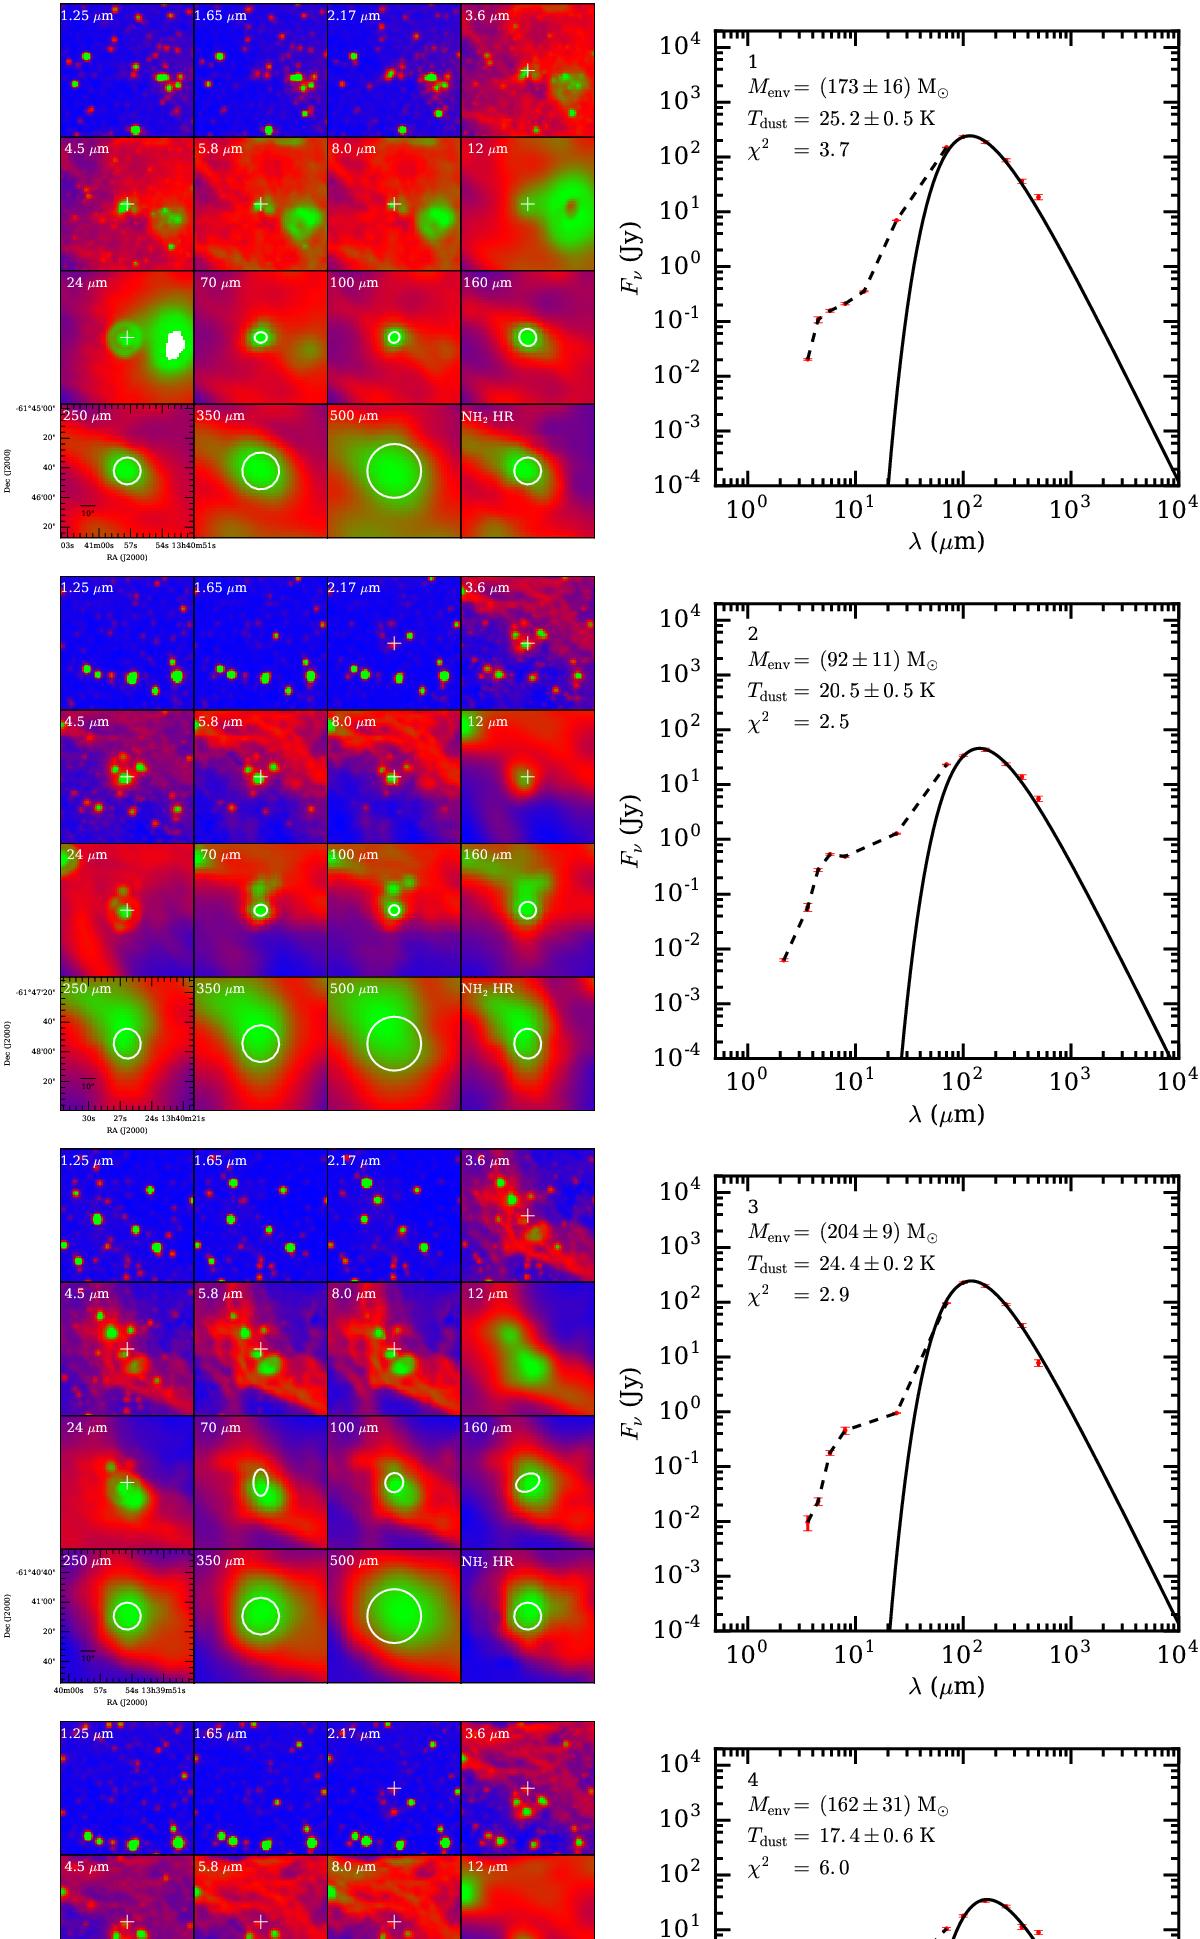
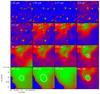
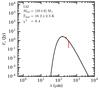
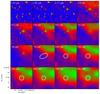
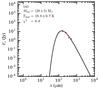
Left: plot consisting of multiwavelength images from 1.25 to 500 μm along with the ![]() resolution column density map. All images are resampled to the same pixel size (2″) for a better display effect. The coordinates of compact sources with IR point counterparts are shown in the cross and the photometry apertures in the Herschel bands are marked in the ellipse. Right: SED fitting plot. The filled circle symbolizes the flux at each wavelength available to each source. The solid line indicates the graybody fitting to the available fluxes at 100 to 500 μm and the dashed line is the connecting line among the available IR fluxes at 1.25 to 70 μm.
resolution column density map. All images are resampled to the same pixel size (2″) for a better display effect. The coordinates of compact sources with IR point counterparts are shown in the cross and the photometry apertures in the Herschel bands are marked in the ellipse. Right: SED fitting plot. The filled circle symbolizes the flux at each wavelength available to each source. The solid line indicates the graybody fitting to the available fluxes at 100 to 500 μm and the dashed line is the connecting line among the available IR fluxes at 1.25 to 70 μm.


Current usage metrics show cumulative count of Article Views (full-text article views including HTML views, PDF and ePub downloads, according to the available data) and Abstracts Views on Vision4Press platform.
Data correspond to usage on the plateform after 2015. The current usage metrics is available 48-96 hours after online publication and is updated daily on week days.
Initial download of the metrics may take a while.