Fig. 8
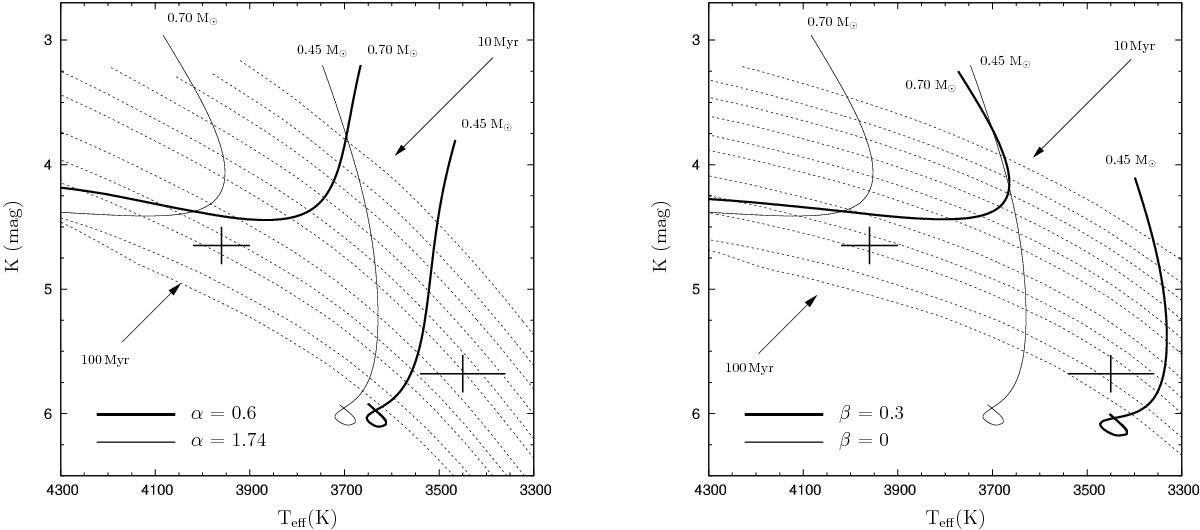
TPD12 models recalculated to include the effects of the stellar magnetic field. Left: effect of an internal magnetic field, simulated by using a value of α = 0.6. The isomasses of the solar value α = 1.74 are also plotted for comparison. Right: effect of stellar spots, computed for an effective spot coverage of β = 0.3 (Somers & Pinsonneault 2015). The isomasses for β = 0 (standard models with no spots) are also plotted for comparison. In both cases, the isochrones (dashed lines) of the altered models are also shown and are to be compared with the isochrones of the TPD12 models in Fig. 7. See text.
Current usage metrics show cumulative count of Article Views (full-text article views including HTML views, PDF and ePub downloads, according to the available data) and Abstracts Views on Vision4Press platform.
Data correspond to usage on the plateform after 2015. The current usage metrics is available 48-96 hours after online publication and is updated daily on week days.
Initial download of the metrics may take a while.