Fig. 1
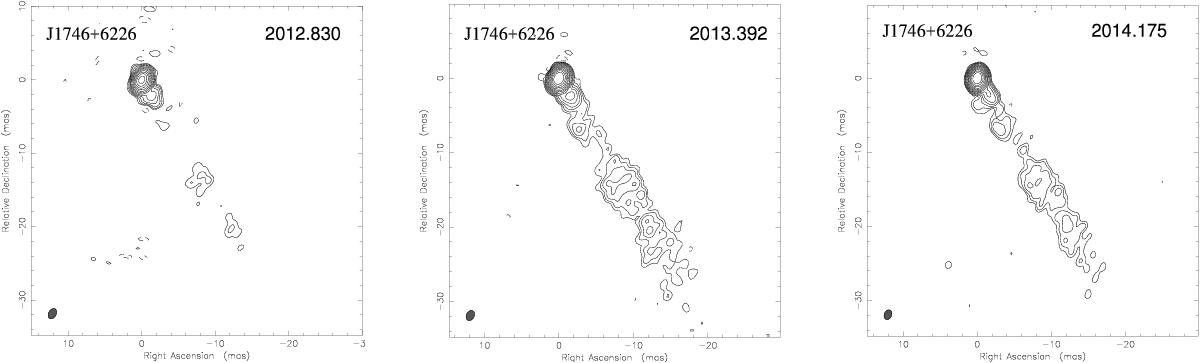
Maps of J1746+6226 (calibrator of HD 160934) in the three epochs. In each map, the lowest contour levels correspond to 4 times the statistical rms noise (0.5, 0.2, and 0.2 mJy beam-1) with a scale factor between contiguous contours of ![]() . The peak flux densities in the images are 0.32, 0.32, and 0.34 mJy beam-1, respectively. The different morphology in epoch 2012.830 is due to the larger rms.
. The peak flux densities in the images are 0.32, 0.32, and 0.34 mJy beam-1, respectively. The different morphology in epoch 2012.830 is due to the larger rms.
Current usage metrics show cumulative count of Article Views (full-text article views including HTML views, PDF and ePub downloads, according to the available data) and Abstracts Views on Vision4Press platform.
Data correspond to usage on the plateform after 2015. The current usage metrics is available 48-96 hours after online publication and is updated daily on week days.
Initial download of the metrics may take a while.