Fig. 3
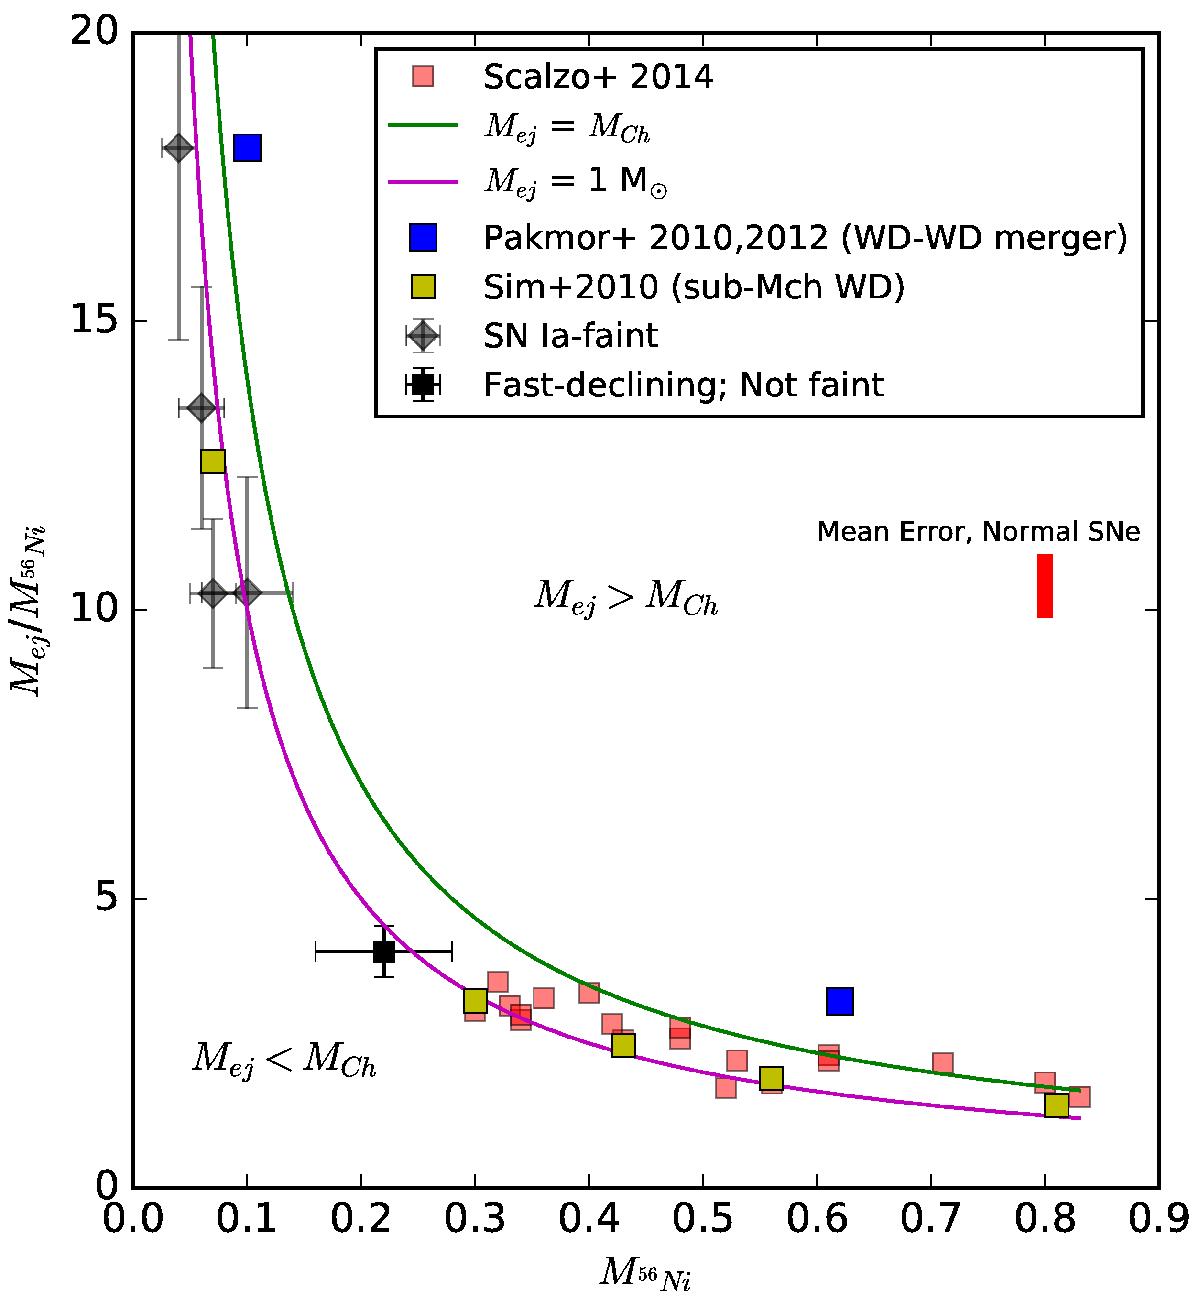
Ratio of the ejecta mass to 56Ni mass is plotted against the 56Ni mass. With decreasing ejecta mass the black points are SNe 2005ke, 2006mr, 2007on 2007ax and 2009F, the last two of which lack NIR coverage. The diamonds are the SN Ia-faint sub-group and the square is 2007on which is fast-declining but not in the sub-group. The red points are normal SN Ia taken from Scalzo et al. (2014). We also plot the values from different model scenarios. The yellow squares are sub-MCh double detonation models from Sim et al. (2010), blue squares from violent merger models for normal and subluminous SNe from Pakmor et al. (2010, 2012), the green curve is the ratio for a MCh explosion and the magenta curve is the ratio for a sub-MCh explosion with Mej of 1 M⊙. We plot the typical error bar for the normal SNe from Scalzo et al. (2014) in red.
Current usage metrics show cumulative count of Article Views (full-text article views including HTML views, PDF and ePub downloads, according to the available data) and Abstracts Views on Vision4Press platform.
Data correspond to usage on the plateform after 2015. The current usage metrics is available 48-96 hours after online publication and is updated daily on week days.
Initial download of the metrics may take a while.