Fig. 1
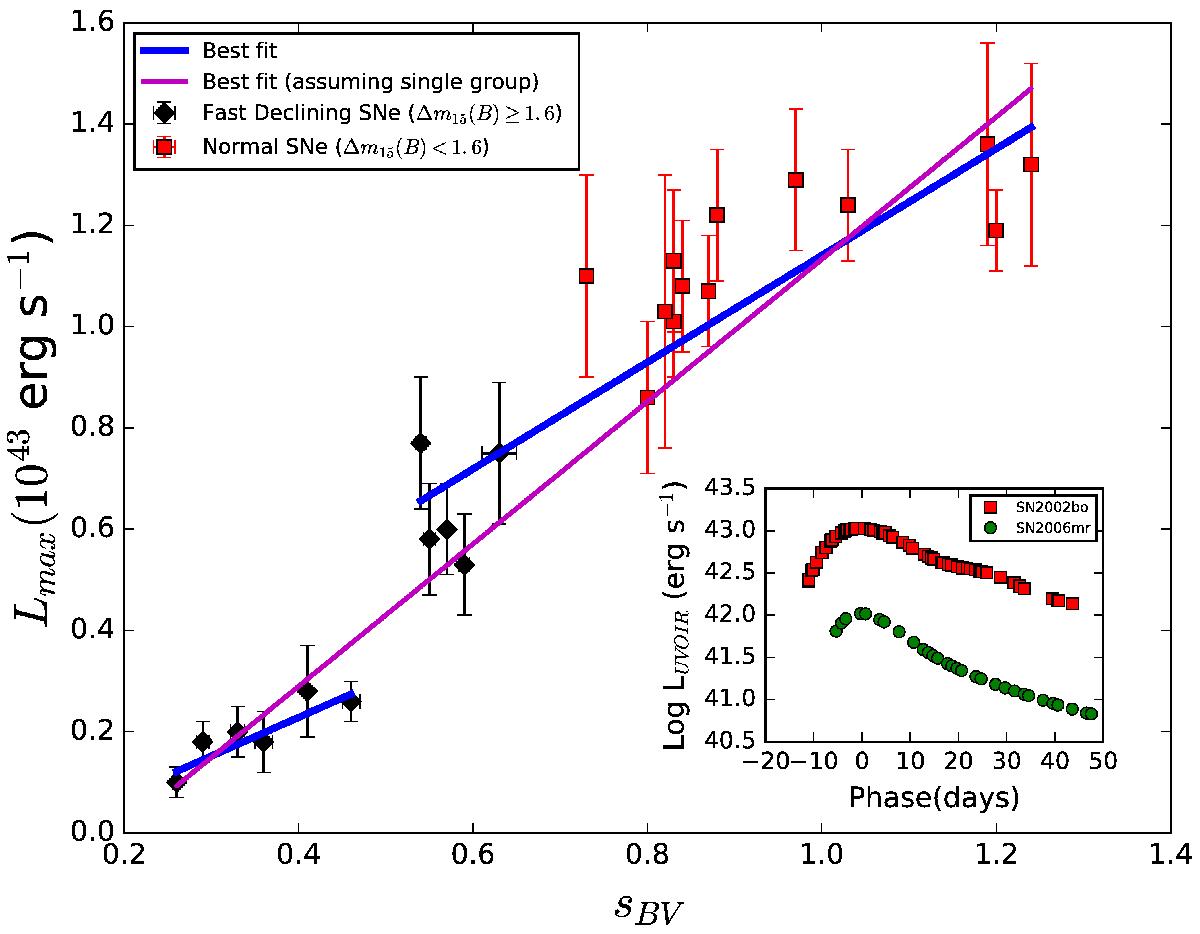
Lmax versus sBV for normal SN Ia (red) and fast-declining SN Ia (black). The best-fit linear relations for the faint sub-group of the fast-declining SN Ia, the normal SNe, and the best-fit assuming that all SNe belong to the same group are plotted as solid lines. Inset: the u → H pseudo-bolometric light curve for SN 2006mr (green), the faintest SN in the sample is plotted in comparison with the normal SN 2002bo (red, Benetti et al. 2004).
Current usage metrics show cumulative count of Article Views (full-text article views including HTML views, PDF and ePub downloads, according to the available data) and Abstracts Views on Vision4Press platform.
Data correspond to usage on the plateform after 2015. The current usage metrics is available 48-96 hours after online publication and is updated daily on week days.
Initial download of the metrics may take a while.